The study, published in Nature Food, presents EDGAR-FOOD – the first database to break down emissions from each stage of the food chain for every year from 1990 to 2015. The database also unpacks emissions by sector, greenhouse gas and country.
According to the study, 71 per cent of food emissions in 2015 came from agriculture and “associated land use and land-use change activities” (LULUC).
The rest stemmed from retail, transport, consumption, fuel production, waste management, industrial processes and packaging.
The study finds that CO2 accounts for roughly half of food-related emissions, while methane (CH4) makes up 35 per cent – mainly from livestock production, farming and waste treatment.
Emissions from the retail sector are rising, the study finds, and increased by 3-4 times in Europe and the US between 1990 and 2015.
The authors also find that “food miles” contribute less to food emissions than packaging. The authors add that 96 per cent of the emissions from transporting food come from local or regional transport by road and rail, rather than international transport.
‘An excellent database’
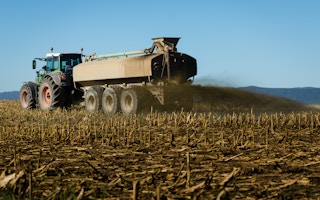
While feeding the world’s population of almost 8bn people is a fundamental task, it comes at a heavy cost to the climate.
Food production uses up half of the Earth’s habitable land and a 2019 report from the Intergovernmental Panel on Climate Change (IPCC) estimated that between 21-37 per cent of global emissions are derived from food systems.
(Last year, Carbon Brief produced a week-long series of articles, discussing the climate impacts of meat and dairy, outlining how changing diets are expected to affect the climate, and asking how we can change our eating habits to minimise our carbon footprint.)
The new study presents EDGAR-FOOD – the first database to cover each stage of the food chain for all countries, providing data for every year between 1990 and 2015.
The database estimates CO2, CH4, nitrous oxide (N2O) and fluorinated gas emissions for each stage of the food system, as well as by country.
University of Oxford’s Dr John Lynch, who researches the climate impacts at food and was not involved in the study, tells Carbon Brief that it “has often been hard to get fully detailed coverage across the whole food system” and that this new paper is a “great resource”.
Dr Sonja Vermeulen – director of programmes at the Consultative Group on International Agricultural Research (CGIAR), who also was not involved in the study – adds that this is an “an excellent database and set of analytic tools to signpost the way forward for food”.
Vermeulen notes that she published “perhaps the first estimate of total food system emissions” around a decade ago, estimating that food systems account for one-third of emissions.
This is the same estimate as the new database, she notes, but adds that her figure was “based on much rougher data and calculations” than the new assessment and “it is great to see the figure grounded much more strongly in evidence and detail”.
Global food emissions
The study finds that global food production increased 40 per cent between 1990 and 2015, and that annual emissions from the food system rose from 16bn tonnes of CO2e (GtCO2e) to 18GtCO2e.
However, it adds that, on an individual basis, per capita food-related emissions decreased from an average of 3 tonnes of CO2e in 1990 to 2.4tCO2e in 2015.
Furthermore, the contribution of food systems to total human-caused emissions actually dropped from 44 to 34 per cent in this time, according to the paper.
This is due to the global increase in emissions from other sectors, the paper says. Lynch says that this finding highlights the need to decarbonise:
“As a fraction of total GHG emissions, food emissions are actually declining, because we’re increasing emissions even faster in other sectors – largely burning fossil fuels for more energy. So, while it’s great there is ever more attention on the environmental impacts of the food system, it highlights that decarbonisation must still be our climate priority.”
In 2015, 27 per cent of emissions from food came from “industrialised countries”, the paper says, with the remaining 73 per cent coming from “developing countries” – within which the researchers include China. The six economies with the largest food system emissions are made up of a mix of “industrialised” and “developed” countries, according to the report:
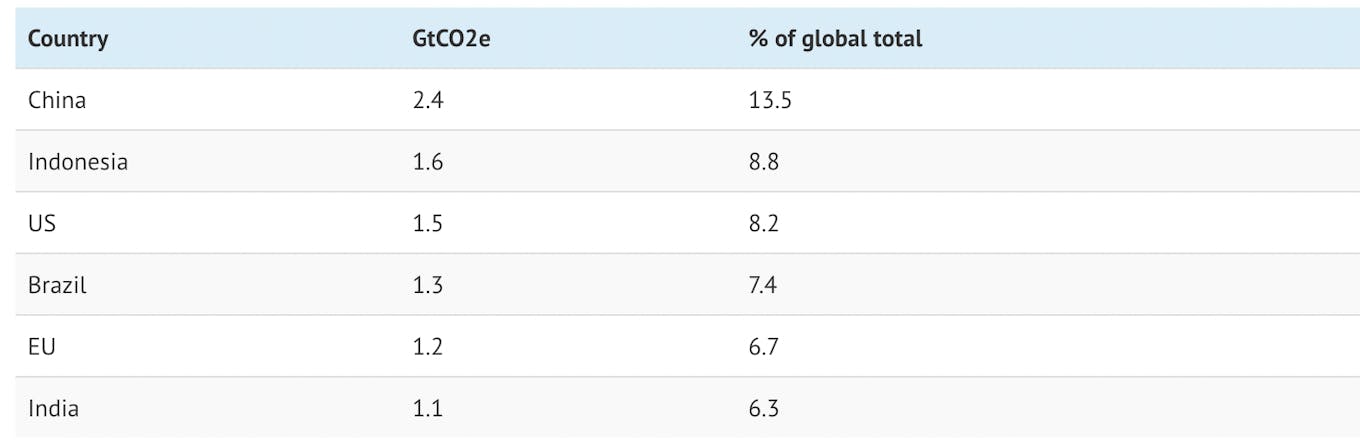
Table showing the six economies whose food systems produce the most emissions. Source: Crippa et al (2021).
The study notes that the share of a country’s emissions that comes from its food system ranges from 14 to 92 per cent.
In industrialised countries, roughly 24 per cent of the countries’ total emissions came from their food systems – a number that has stayed fairly stable between 1990-2015, according to the study.
However, the researchers find that the share of emissions that come from food in developing countries decreased from around 68 per cent in 1990 to 38 per cent in 2015.
This is due to the “very high increases in non-food emissions”, the authors say, as well as a “significant reduction in land-based emissions” – primarily thanks to a reduction in deforestation.
The study adds that Asia is the highest contributor to global food emissions when measured by continent – producing 35 per cent of global food system emissions in 1990 and 49 per cent in 2015.
The map below shows food-system emissions as a proportion of total emissions for each country, for 1990 (left) and 2015 (right). For example, dark green shading indicates countries where food-related emissions account for more than half of their total emissions.
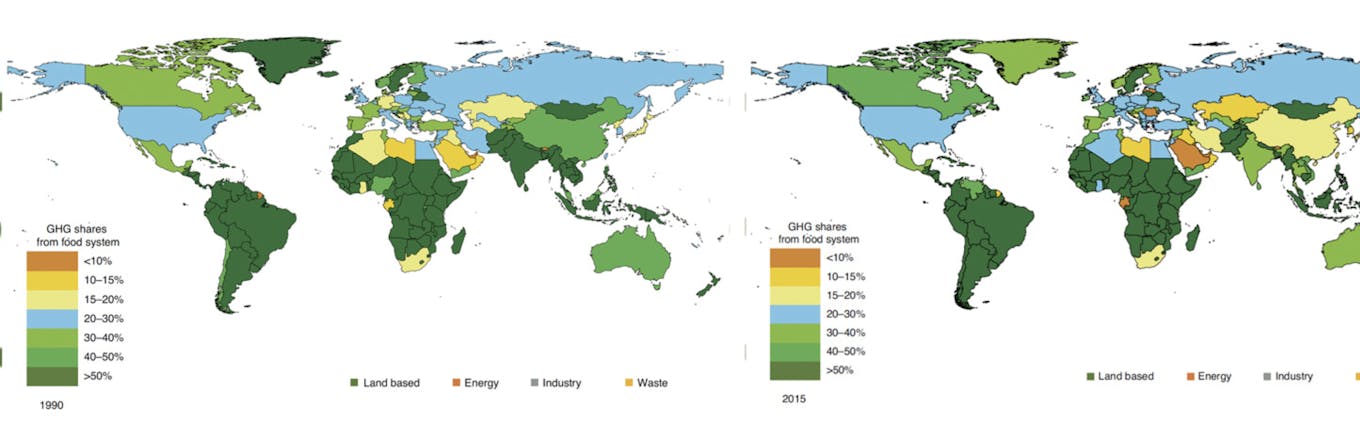
The share of greenhouse gas emissions from food systems as a fraction of total emissions for each country in 1990 (left) and 2015 (right). Source: Crippa et al (2021).
Vermeulen was a commissioner in the EAT-Lancet Commission on Healthy Diets from Sustainable Food Systems. She tells Carbon Brief that it is possible to eat well and care for the planet, but will require effort:
“It is theoretically possible, even with population growth, for everyone in the world to eat a healthy and culturally appropriate diet without transgressing planetary boundaries for carbon, biodiversity, nitrogen, phosphorus and water. But that will take a lot of effort both technically and politically.”
The new study highlights that we need a “mixed bag of technical and political solutions”, she adds:
“Their analysis reinforces that there’s no single silver bullet – if we focus only on more plant-based diets, or only on improved agricultural practices, or only on the energy and transport sectors, we won’t get to where we need to be – we need all three.”
Production stages
The authors also divide up emissions into the different stages of the food system. For 2015, they find that the early stages of food production — those that take foodstuffs to the “farm gate”, including fishing, aquaculture, agriculture and emissions from inputs such as fertilisers – contributed 39 per cent of total food system emissions.
LULUC was the second-largest contributor, contributing one-third of total food system emissions. This was mainly due to carbon losses from deforestation and from degradation of soils, including peatlands, according to the study.
The authors note that most of the LULUC emissions are from developing countries – in 2015, for example, agriculture and LULUC made up 73 per cent of food emissions in developing countries.
However, they note that between 1990 and 2015, the share of food emissions from agricultural production and LULUC dropped by 13 and 26 per cent in developing nations, respectively.
Transport, packaging, retail, processing, consumption and end-of-life disposal made up the remaining 29 per cent of emissions in 2015, the authors say. This value has risen since 1990 in both industrialised and developing countries, the study notes.
The global share of food emissions that come from the energy sector increased by 31per cent over 1990-2015, the study finds. It adds that in 2015, “energy-related” sectors – including industry and waste – made up over half of food emissions in industrialised countries.
The authors also find that “food miles” contribute slightly less to food emissions than packaging. Packaging contributed about 5.4 per cent of food emissions — mainly due to the pulp and paper industry — whilst transportation was responsible for only 4.8 per cent.
How are food emissions changing?
The authors also analyse the contribution of different greenhouse gases in the food system. For example, they found that CO2 makes up around half of food system emissions.
The Sankey diagram below shows the contribution of different activities and types of greenhouse gases to overall food system emissions.

Sankey diagram illustrating the breakdown of emissions from the global food system in 2015. Data is shown – from left to right – by gas, sector, stage, category and then gas again. Mouse over the different sections to see the data in percentages. Data from Crippa et al (2021). Chart by Carbon Brief using Highcharts.
The authors note that CH4 accounts for 35 per cent of total emissions from the food system. This is mainly due to livestock production, farming and waste treatment.
However, the authors also note that rice – one of the leading food crops – is a “principal source” of methane emissions.
The study finds that although emissions from fluorinated gases (f-gases) account for only 2 per cent of emissions, their use doubled between 1990-2015.
F-gases are mainly used in refrigeration, the authors say, and as developing nations increase their industrial and domestic refrigeration, “the importance of refrigeration to total greenhouse gas emissions is likely to increase”.
This story was published with permission from Carbon Brief.


