Emissions from electricity generation would have fallen, but droughts forced countries to increase fossil fuel use to cover declines in hydropower.
The findings come from a new report by thinktank Ember, covering 78 countries and 92 per cent of global electricity demand in the first half of 2023.
The report shows that global electricity demand growth and the expansion of low-carbon supplies remain delicately balanced, with ongoing droughts putting a question mark over Ember’s earlier prediction of a decline in fossil-fueled power in 2023.
While expanded wind and solar capacity met a record 14.3 per cent of global electricity demand in the first half of this year, up from 12.8 per cent a year earlier, hydro generation fell by 8.5 per cent.
With a small rise in fossil-fueled power helping to make up for the drop from hydro, emissions from the sector plateaued rather than declining, despite weak electricity demand growth.
The expansion of low-carbon electricity supplies overall remains insufficient to put the world on track for limiting warming to 1.5°C, according to Ember’s report.
Solar topples records
Global wind and solar generation continued to increase across the first six months of 2023, according to Ember.
The amount of electricity generated by solar and wind rose to 1,930 terawatt hours (TWh), up 12 per cent from 1,717TWh during the first half of 2022. This accounted for 14.3 per cent of global electricity generation overall, of which 5.5 per cent came from solar and 8.8 per cent came from wind.
“
The world is teetering at the peak of power sector emissions, and we now need to unleash the momentum for a rapid decline in fossil fuels by securing a global agreement to triple renewables capacity this decade.
Malgorzata Wiatros-Motyka, senior electricity analyst, Ember
In percentage terms, both sources grew more slowly than in the same period last year. For example, wind output grew 10 per cent in the first half of 2023 compared to 16 per cent in the same period last year. Solar grew 16 per cent, compared to 26 per cent in the first half of 2022.
Such levels of growth are below what is needed to limit warming to 1.5°C under the International Energy Agency’s (IEA) net-zero emissions by 2050 scenario, which requires a yearly average growth of 17 per cent for wind and 24 per cent for solar up to 2050, Ember notes.
Similarly, in absolute terms, the growth in wind and solar generation was below the levels seen in 2022. Solar grew by 104TWh, down from 132TWh in the same period last year. Wind increased by 109TWh, compared to 147TWh in the same period last year.
Some 50 countries set new monthly records for solar generation in the first half of 2023, Ember says. This includes 24 of the EU’s 27 members seeing new solar highs as of June.
China, meanwhile, generated 50TWh (6.4 per cent of its electricity) from solar in June 2023, up by 9.7TWh (+25 per cent) on the previous June. This means China’s solar generation in one month would be enough to power New Zealand, Qatar or Hungary for a whole year.
Records were also broken in the US, Mexico, Brazil and Chile, among many others in the Americas, Ember says. As shown in the below chart, where the light green line shows solar trending above 2022 generation levels (dark green line) across a range of countries worldwide.
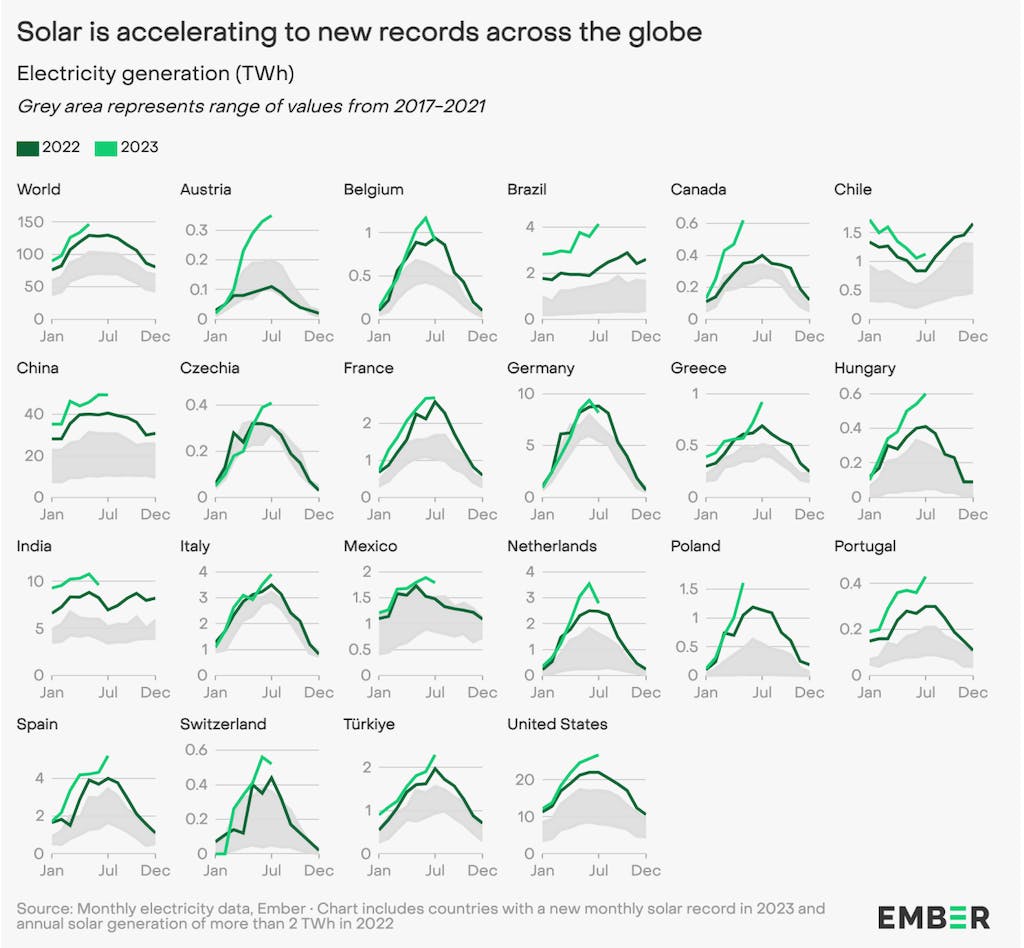
Source: Ember
Having peaked in 2020, wind capacity additions have trended downwards over the past few years, according to Ember. In 2020, 111 gigawatts (GW) of capacity were installed worldwide, in 2021 it was 92GW and in 2022 it was 73GW.
Wind generation growth has similarly slowed, with the largest increase in history (+268TWh) in 2021. This then decreased to +251TWh in 2022, and 109TWh in the first half of 2023.
As with solar, China is surging ahead on wind, being responsible for 91 per cent of global growth in generation in the first half of this year, according to Ember.
China saw a 26 per cent growth in wind generation in the first half of 2023 compared to the same period in 2022. In contrast, wind generation in the EU grew by just 4.8 per cent and in Japan by 2.4 per cent, from an already low baseline, the report notes.
Together, wind and solar generation increased by 213TWh in the first six months of 2023. This increase was much larger than the growth in global electricity demand of 59TWh. However, with hydro output falling dramatically due to drought (see below), there was still a small increase in fossil fuel use and emissions..
Without the increase from wind and solar, global power sector emissions would have risen by 154m tonnes of CO2 (MtCO2, 2.6 per cent), instead of the 12MtCO2 (0.2 per cent) actually seen, according to Ember.
Hydropower drops by record amount
In the first six months of 2023, global hydropower generation fell by 8.5 per cent (-177TWh), according to Ember. Hydro generated 1,898TWh of electricity, some 14 per cent of the global total in the first half of the year, in comparison with 2,074TWh (15 per cent) in the same period of 2022.
The decrease in hydropower generation was caused by droughts, which Ember says were likely exacerbated by climate change. The fall in the six months to June (dark blue) was larger than any decline recorded across a full year in the last two decades, as shown in the chart below.
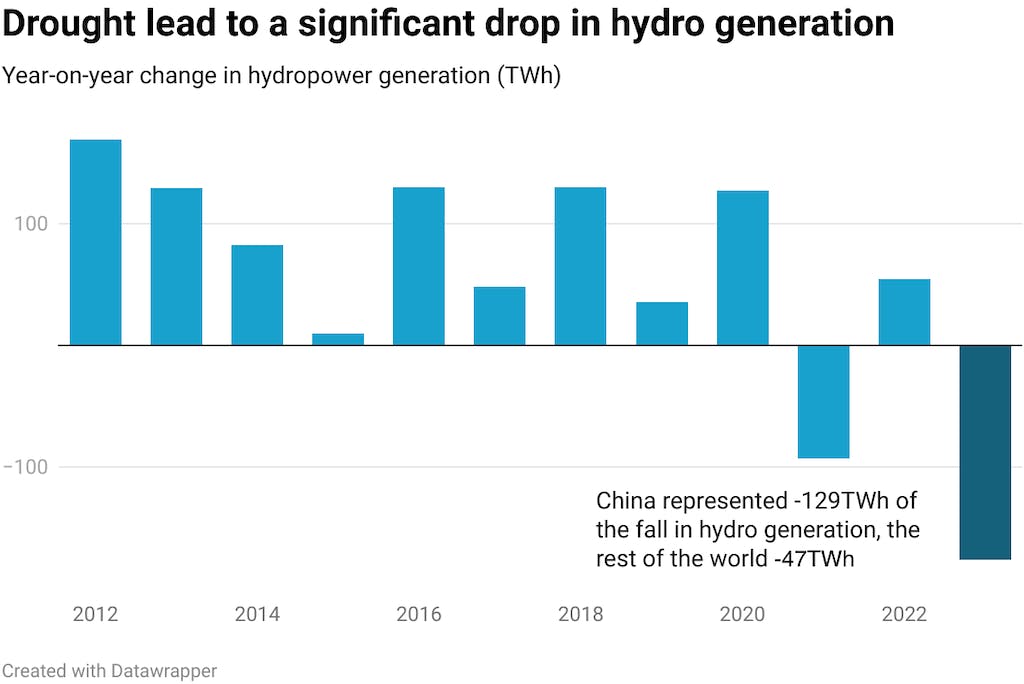
Year-on-year change in hydropower generation, terawatt hours, demonstrating the scale of the drop in generation in the first half of 2023. Source: Ember. Chart by Molly Lempriere for Carbon Brief using Datawrapper.
This was most notable in China, which accounted for around three-quarters of the fall.
China is home to nearly a third of the world’s hydropower generation (30 per cent in 2022).
This year, the country’s hydropower sector was hit by summer droughts for the third consecutive year, as reported by Carbon Brief’s China Briefing.
In July, China’s National Bureau of Statistics announced that hydropower output fell by nearly 23 per cent in the first half of 2023 – the largest drop among all electricity sources.
Similarly, the Centre for Research on Energy and Clean Air recorded a “collapse” in output in the month of June, down 34 per cent year-on-year. It attributed this to “drought and pressure to save water for generation during peak demand season in July–August”.
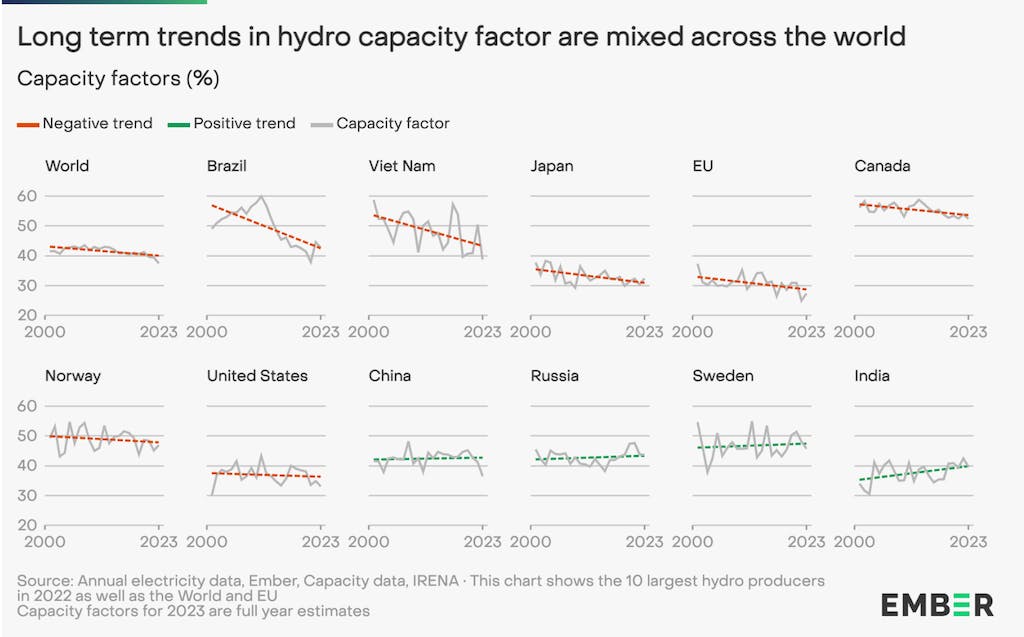
Ember’s analysis found that China’s hydropower “capacity factor” fell to 30.5 per cent in the first six half of 2023, ten percentage points below the first half of 2022 and the lowest value since at least 2015.
Beyond China, the global capacity factor for hydropower generation fell to 35.6 per cent, nearly four percentage points lower than in the first half of 2022. Across the last decade, the average global hydropower capacity factor was 40.9 per cent, notes Ember.
Source: Ember
According to the IEA’s electricity market report, the capacity factor of global hydropower has been a declining trend over the last decade. It has fallen from an average of 38 per cent in 1990-2016, to about 36 per cent in 2020-2022.
This 2 per cent difference means installed hydropower is producing about 240TWh less electricity than it would have produced had the capacity factor stayed the same as it was a decade ago, the IEA report notes.
It adds:
“As a result, an amount of energy as large as Spain’s annual electricity consumption needs to be produced by other dispatchable sources of power, which is currently supplied mainly by fossil-fired generation.”
Currently, 2023 is likely to set a record for the lowest global hydropower capacity factor in recorded history, if conditions fail to substantially improve, Ember adds.
Fossil fuel generation increased to meet the shortfall created by low hydropower rates. If hydropower generation had matched its rate in 2022, power sector emissions would have fallen by 2.9 per cent, Ember says.
Ember suggests that the way hydropower capacity has been hit in the first six months of 2023 is a “warning shot” about how the technology could negatively affect the speed of the electricity transition, given its susceptibility to climate change.
In a statement, Malgorzata Wiatros-Motyka, senior electricity analyst at Ember, says:
“It’s still hanging in the balance if 2023 will see a fall in power sector emissions. While it is encouraging to see the remarkable growth of wind and solar energy, we can’t ignore the stark reality of adverse hydro conditions intensified by climate change. The world is teetering at the peak of power sector emissions, and we now need to unleash the momentum for a rapid decline in fossil fuels by securing a global agreement to triple renewables capacity this decade.”
The Intergovernmental Panel on Climate Change (IPCC) sixth assessment report states that by 2080, climate conditions could affect hydropower generation by between +5 per cent and -5 per cent, under a high emissions scenario. However, it said the expected impact varies significantly depending on the region.
Demand drops in major economies
Across the first six months of 2023, global demand for electricity grew by just 0.4 per cent, according to Ember.
This is much lower than the average annual growth rate between 2012 and 2022, which sat at 2.6 per cent.
Major economies saw falls in demand, including Japan (-5.6 per cent), the EU (-4.6 per cent), the US (-3.4 per cent) and South Korea (-1.4 per cent), leading to a decline in their fossil fuel use for electricity.
This fall in demand in high income economies was due to a number of reasons, according to Ember. In the EU, for example, this continued a trend that began in March 2022, when Russia invaded Ukraine.
Policy measures designed to reduce demand amid the wider energy crisis and concerns over the security of gas, falling output from energy intensive industries, mild winter weather, and reduced personal use due to the cost of living crisis, all contributed.
Mild weather and slower economic activity also drove electricity demand reductions in the US and Japan, Ember says.
Meanwhile, India saw lower-than-expected demand growth in the first six months of 2023, according to the report, rising 3.1 per cent compared to 10.7 per cent in the same period last year. This was lower than the average growth seen from 2012-22 (5.4 per cent).
In China, electricity demand increased by 6 per cent, which is in line with the China Electricity Council’s national estimates, Ember notes, and the historic average for 2012-22 (+5.9 per cent). This reflects China’s rebound from Covid lockdowns in 2022 as well as heatwaves during May and June.
Demand growth is unlikely to continue at such a slow level globally in the future, especially in mature economies that are looking to electrify key sectors such as transport and heating to decarbonise, the report notes.
Electricity demand is set to continue increasing in rapidly-growing economies, including China and India, as they continue to advance their economies and boost electricity access.
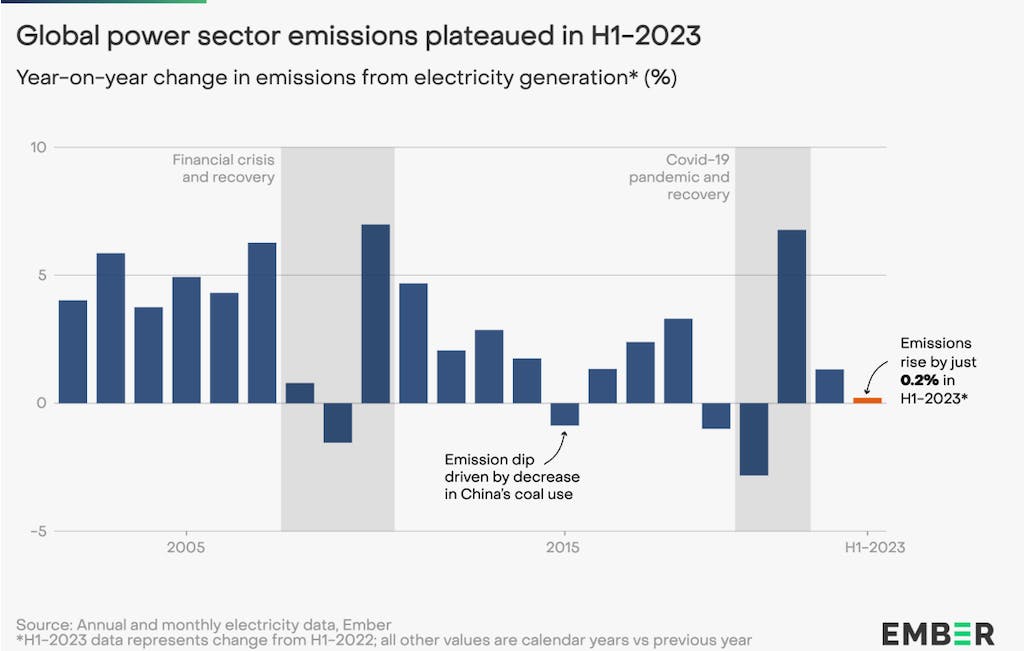
Emissions plateau
Thanks to the increase in solar and wind power generation – and despite the drop in hydro output – global power sector emissions plateaued over the first half of 2023, according to Ember. It says the increase from wind and solar avoided 142MtCO2 of emissions.
Globally, the power sector emitted 5,795MtCO2 in the six months of 2023, up just 12MtCO2 (0.2 per cent) from the same period in 2022. This continued a downwards trend that had been seen in the power sector prior to 2021, as seen in the chart below.
Source: Ember
Falls in power-sector emissions were seen in the EU (-17 per cent), Japan (-12 per cent), US (-8.6 per cent) and South Korea (-3 per cent), largely as a result of falls in coal generation.
Emissions growth slowed in India, Ember says, where there was a 3.7 per cent increase in the first half of 2023, down from 9.7 per cent a year earlier.
However, Ember’s report notes that current progress falls short of what would be needed to keep warming below 1.5°C, stating:
“Power-sector emissions need to be falling fast this decade, not just plateauing. Moreover, having falling emissions when demand is exceptionally low is not enough; emissions must be falling even when global demand is increasing as the world consumes more electricity and moves towards electrifying the entire economy.”
In economies where emissions rose, this was due to an increase in fossil fuel generation.
Globally, fossil-fueled power reached 8,100TWh in the first half of 2023, accounting for 59.9 per cent of global generation overall. This was an increase of 9TWh (0.1 per cent) from a year earlier.
Coal generation increased by 1 per cent (47TWh) and gas generation by 0.5 per cent (14TWh), however other fossil fuel (mainly oil) generation fell 15 per cent (-52TWh).
The changes varied significantly at regional and country level. For example, in China, coal generation increased by 203TWh (8 per cent) in the first half of 2023. This was largely due to the hydropower deficit (129TWh) and contributed to China’s emissions for its power sector rising by 7.9 per cent (173MtCO2).
Without the need to meet the hydropower deficit, China’s coal generation would only have risen by 74TWh (2.9 per cent), according to Ember. This would have been enough to turn the observed 47TWh rise in global coal generation into a fall of 82TWh.
Meanwhile, in the EU, fossil generation fell to its lowest since at least 2000 in the first half of 2023, at 410TWh.
The fall was Europe-wide, with 11 countries seeing a decline of at least 20 per cent and five a decline of more than 30 per cent (Portugal, Austria, Bulgaria, Estonia and Finland), as detailed in an earlier report from Ember, covered by Carbon Brief.
Coal generation in the bloc fell 23 per cent (-49TWh), in contrast to the global rise of 1 per cent.
This story was published with permission from Carbon Brief.


