
The analysis of data from 2019 highlights “significant inequalities” in energy use across the country. Those in the top 10 per cent of incomes used nearly three times as much energy in a year as people in the bottom 30 per cent.
This was particularly true for transport. Car journeys and flights taken by the richest British people – especially “white, wealthy middle-aged men” – used more energy that year than 60 per cent of the population got through in total.
The authors of the study, published in Ecological Economics, say energy consumption is currently “too high” to achieve the world’s climate targets, even as many indulge in “excess energy use” while millions languish in fuel poverty.
Yet, by combining their energy analysis with measures of well-being, they conclude that a high standard of living can be achieved in the UK with relatively low levels of energy consumption.
Experts tell Carbon Brief that this research should encourage those in power to devise policies that target the excessive energy use of the rich, such as frequent flyer levies.
Large footprints
The study assesses the annual “energy footprint” of people in the UK. This includes a detailed breakdown of the energy used for everything from building their furniture to powering the restaurants where they eat.
Those in the global north are known to be disproportionately responsible for both energy use and greenhouse gas emissions. The average person in the UK uses roughly four times as much energy in a year as someone in India and 21 times as much as someone in east Africa.
But within these relatively high-income nations there are large variations in wealth and the energy intensity of people’s lifestyles.
In order to assess the energy use of different activities, the team led by Dr Marta Baltruszewicz, as part of the Living Well Within Limits project at the University of Leeds, drew together a range of datasets concerning British people’s lives.
In particular, they merged data collected in 2019 for the UK living costs and food survey conducted by the Office of National Statistics (ONS) and Understanding Society, a wide-ranging survey touching health, work, social life and other subjects, conducted by the University of Essex.
This approach allowed them to isolate how much energy people in different income brackets used for different activities. The chart below shows this breakdown.
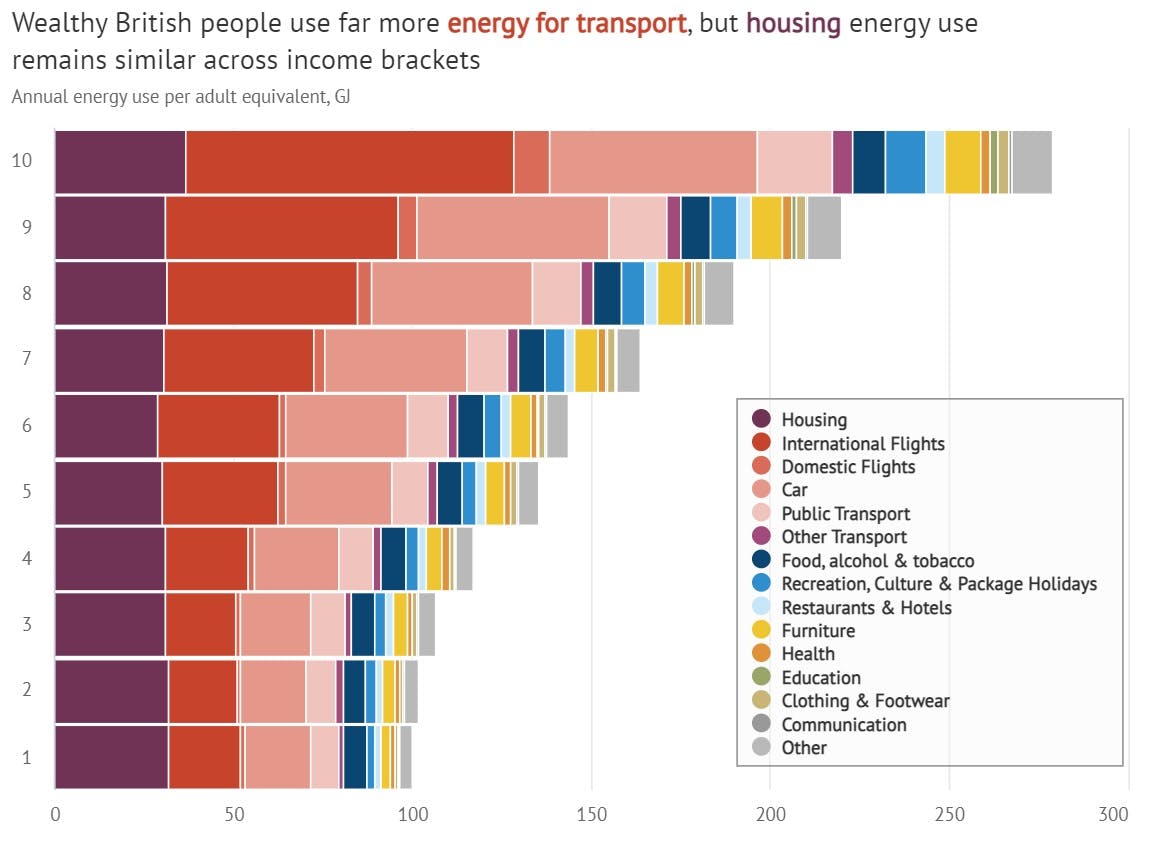
Energy footprints of British households in 2019 by income grouping, where 1 is the lowest income 10 per cent of the population and 10 is the highest income 10 per cent. Footprints are measured in gigajoules (GJ) per “adult equivalent”, which is based on dividing the energy use of a household by the number of people, accounting for the fact that children contribute less. Chart made by Tom Prater for Carbon Brief using Highcharts. Source: Baltruszewicz et al. (2022).
The inequality is huge. In 2019, the wealthiest 10 per cent of people in the UK used around three times as much energy driving cars and six times as much for recreational activities, when compared to the bottom 10 per cent.
The greatest disparity came from people’s use of planes. Both domestic and international flights taken by people with the highest incomes used around 10 times more energy than those taken by the poorest.
In fact, as the chart below shows, the 102 gigajoules (GJ) used for flying by the average adult in the top 10 per cent of earners in that year was more than the average person in the bottom fifth of earners used for everything, including flying, driving and heating their homes.
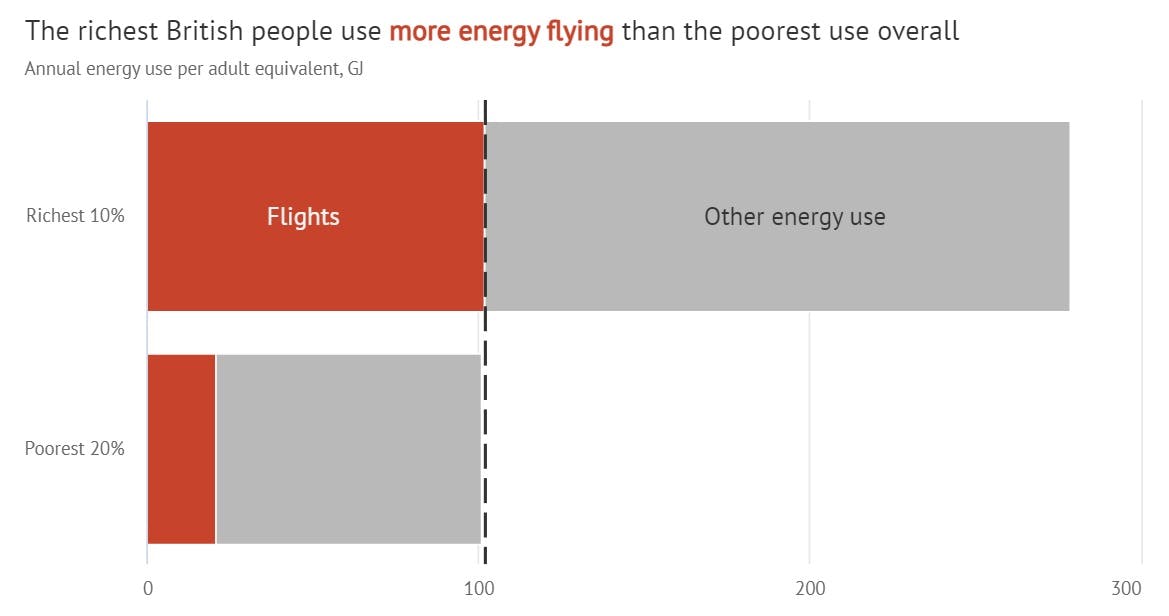
Energy footprints of British households in 2019, from international and domestic aviation (red) and everything else (grey), in the top 10 per cent and the bottom 20 per cent of incomes. Chart made by Tom Prater for Carbon Brief using Highcharts. Source: Baltruszewicz et al. (2022).
Transport experts tell Carbon Brief the figures for air travel are in line with their expectations. “Most people are not aware that 70 per cent of the flights taken in this country are by just 15 per cent of the population,” says Matt Finch, UK policy manager at the NGO Transport & Environment.
Baltruszewicz and her team were also able to assess who precisely was responsible for “unabated excess energy” use. They found that “those who most often overshoot energy use are white, wealthy middle-aged men”. By comparison, Baltruszewicz tells Carbon Brief:
“Those who are most energy poor…They also tend to be non-white, female [and] rent houses…there is so much social injustice engrained in those who don’t have enough energy.”
Prof Ian Gough from the London School of Economics, who has conducted research in this field, but was not involved in the study, notes that bringing together a variety of datasets allowed the researchers to single out detailed components such as international flights in a “very powerful way”.
High wellbeing
With the wealth of data at their disposal, the researchers were able to link UK energy use to different measures of well-being including health, loneliness and energy poverty.
They used the metrics available to set an overall “well-being score”. The relationship between this score and increasing levels of energy use can be seen in the chart below.
It shows that at the lower end of the energy use spectrum, well-being initially increases a lot as energy footprint rises. But there are “diminishing or no returns” as energy use gets higher. There is also a large range within each group, reflecting the number of factors at play.
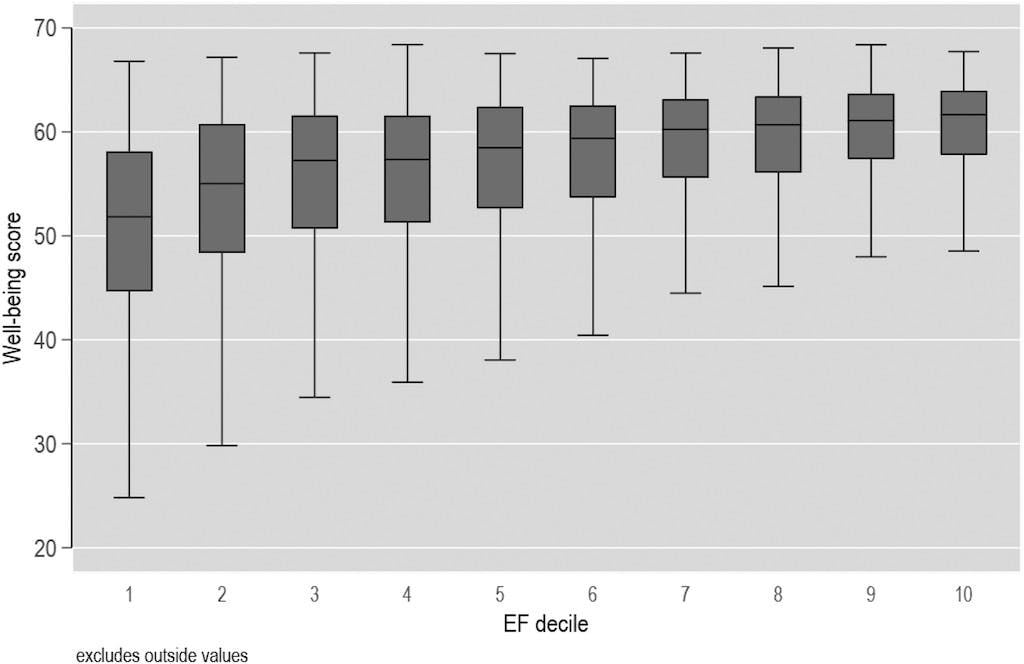
Wellbeing score - based on a combination of physical and mental health, loneliness, energy poverty and other measures - by energy footprint decile. The top of the box is 75th percentile, the middle line corresponds to the median, the bottom line of the box is the 25th percentile. Source: Baltruszewicz et al. (2022).
The average British person the researchers classed as having “high well-being” used 183GJ of energy in 2019, compared to the average value of 156GJ.
However, they also found that around one-quarter of those living on less than 100GJ per year also scored highly for well-being. These people tended to fly and drive much less, and own a house in an urban area.
The authors conclude that “excess” energy use is not essential for a high quality of life.
However, they also emphasise that living a low-energy lifestyle depends on many factors. For example, people living in uninsulated houses in rural areas might require more energy to keep them warm or drive their car, due to the lack of public transport.
Despite this complexity, Baltruszewicz says there are energy uses that clearly need to be addressed. In particular, she points out that despite its popularity among the rich, there is little correlation between flying and well-being scores:
“So why do we still develop infrastructure for flying…Why do we facilitate something that clearly doesn’t contribute to societal well-being, but is also destroying our climate?”
Demand for change
Dr Mari Martiskainen, a professor of energy and society at the University of Sussex who was not involved in the research, tells Carbon Brief the results are particularly important in the context of a cost-of-living crisis:
“It’s also really important that we start to have these discussions on what is the socially acceptable level of energy consumption…What kind of society do we live in if we have people that have massive amounts of excess energy consumption [who] will then make climate change a lot worse for everyone else, versus people who can’t afford to heat their homes?”
The study comes at a fraught time for UK climate and energy policy.
Russia’s invasion of Ukraine has exposed many British households to unaffordable hikes in energy costs, with more than 8m households facing fuel poverty in the coming months.
“
What kind of society do we live in if we have people that have massive amounts of excess energy consumption [who] will then make climate change a lot worse for everyone else, versus people who can’t afford to heat their homes?
Dr Mari Martiskainen, professor, University of Sussex
From the outset, many European nations responded to the crisis by encouraging their citizens to reduce their energy use. Yet until recent weeks, the UK government seemed ideologically opposed to such measures.


