The IEA’s latest World Energy Outlook 2023 says it now expects CO2 emissions to peak “in the mid-2020s” and an accompanying press release says this will happen “by 2025”.
Yet the IEA’s own data shows the peak in global CO2 coming as early as this year, partly due to what the outlook describes as the “legacy” of the global energy crisis triggered by Russia’s invasion of Ukraine.
Other highlights from Carbon Brief’s in-depth examination of the outlook include:
Yet climate policies remain far from sufficient to limit warming to 1.5°C, the IEA warns.
The outlook reiterates the IEA’s ideas for five “pillars” to keep the path to 1.5°C open at COP28, including targets to triple renewable capacity and double the rate of energy efficiency improvements by 2030.
World energy outlook
The IEA’s annual World Energy Outlook (WEO) is published every autumn. It is widely regarded as one of the most influential annual contributions to the climate and energy debate.
The outlook explores a range of scenarios, representing different possible futures for the global energy system. These are developed using the IEA’s “Global Energy and Climate Model”.
The 1.5°C-compatible “net-zero emissions by 2050” (NZE) scenario was introduced in 2021 and updated in September 2023.
The report notes that the path to 1.5°C is made more difficult by each year of “high emissions and limited progress”, but adds that the “recent acceleration in clean energy” is keeping a path open.
Alongside the NZE is the “announced pledges scenario” (APS), in which governments are given the benefit of the doubt and assumed to meet all of their climate goals on time and in full.
Finally, the “stated policies scenario” (STEPS) represents “the prevailing direction of energy system progression, based on a detailed review of the current policy landscape”. Here, the IEA looks not at what governments are saying, but what they are actually doing.
Annex B of the report breaks down the policies and targets included in each scenario. In effect, the IEA is judging the seriousness of each target and whether it will be followed through.
For example, the provisions of the US Inflation Reduction Act are included in the STEPS. But the US target to cut emissions to 50-52 per cent below 2005 levels by 2030 is only met under the APS.
Among various new policies included in the STEPS since last year’s outlook are Japan’s “green transformation” programme that aims to raise the share of renewables and nuclear in the country’s electricity mix, as well as ensuring all new car sales are low-emissions from 2035.
The report emphasises that “none of the scenarios…should be considered a forecast”. It says:
“The intention is not to guide the reader towards a single view of the future, but rather to promote a deeper understanding of the way that various levers produce diverse outcomes, and the implications of different courses of action for the security and sustainability of the energy system.”
Indeed, the design of the scenarios means that the STEPS is all but guaranteed to have become more ambitious by the time next year’s outlook is published – notwithstanding recent policy rollbacks in the UK – as governments around the world continue to implement their pledges.
This increase in ambition over time, as announced pledges are converted into stated policies, is clear from the historical record. (See below for charts comparing IEA outlooks over time.)
In 2021, the newly introduced NZE took centre stage in the IEA’s outlook, with the scenario mentioned 201 times per 100 pages against just 115 for the STEPS.
The STEPS returned to prominence last year and that trend continues in 2023’s outlook, which mentions the scenario 247 times per 100 pages, against just 157 mentions for the NZE.
Another notable change in the 2023 outlook is its shorter length, at 356 pages, compared with 524 last year and as many as 810 in 2019. As a result, this year’s report allows just five pages each to look specifically at coal, oil and gas, whereas the 2022 edition gave them 20-44 pages each.
Emissions peak as soon as 2023
One of the most striking findings in this year’s outlook is that global energy-related CO2 emissions could peak as soon as this year – and by 2025 at the latest.
Carbon Brief understands that the agency did not want to put a firm marker down on 2023, as the expected peak in global emissions will be affected by economic growth, weather and other factors.
However, Figure 1.15 in the report clearly shows CO2 emissions peaking this year under current policy settings in the STEPS scenario.
This curve is reproduced in the figure below, which illustrates the seismic shifts in the global trajectory for CO2 emissions since the signing of the Paris Agreement in 2015.
The thick black line shows how, for much of recent history, global CO2 emissions have marched relentlessly upwards, as growth in populations and energy use have led to higher fossil fuel use.
The pre-Paris policy baseline is shown in grey, illustrating how, on the eve of the COP21 summit where the deal was agreed, the IEA expected emissions to continue rising for decades.
Since that moment in 2015, the adoption of new climate policies and the accelerating spread of low-carbon technologies has seen the growth in global emissions slowing down.
In 2021, the IEA found government policies had advanced sufficiently to bring about a peak in global energy-related CO2 emissions (grey-blue line), with the subsequent decline deepening in the 2022 outlook (light blue).
This year’s outlook (dark blue) sees emissions peaking as soon as 2023 under current policy settings – two years earlier than expected in 2022 – and falling even more steeply after the peak.
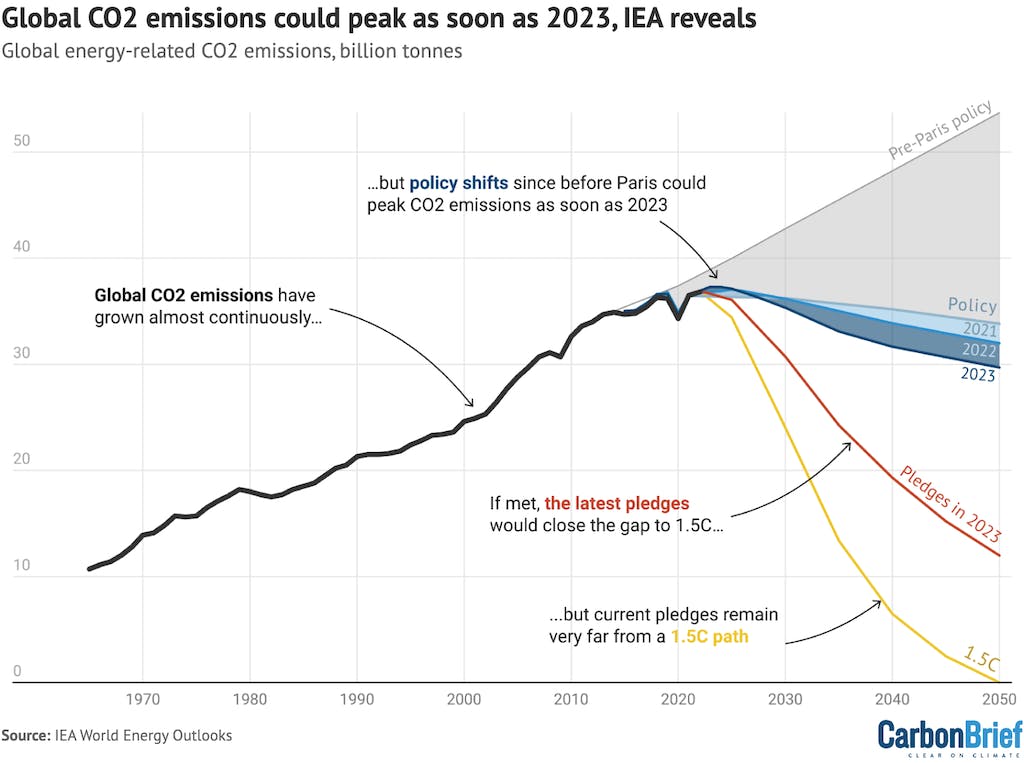
Global CO2 emissions from fossil fuels and industry, billion tonnes, 1965-2050. Chart shows historical emissions (black), pre-Paris policy baseline (grey, 2015 “current policies scenario”), policy in 2021-2023 (blue, “stated policies scenarios”), as well as pledges in 2023 (red, “announced pledges scenario”) and the IEA’s suggested path to staying below 1.5°C (yellow, “net-zero emissions by 2050 scenario”). Source: Carbon Brief analysis by Simon Evans and Verner Viisainen of IEA world energy outlooks 2015-2023. Chart by Tom Prater for Carbon Brief.
Despite the improved outlook for global emissions, the outlook shows that current policies remain massively insufficient to meet governments’ climate pledges – including their long-term net-zero targets. If met, these pledges would see emissions falling along the red line in the figure above.
Moreover, even meeting those climate pledges would fall far short of what would be needed to limit warming to less than 1.5°C above pre-industrial temperatures (yellow line).
‘Beginning of the end’ for fossil fuels
The IEA ascribes the changing outlook for global emissions – at least in part – to the global energy crisis. Last year’s report said that Russia’s invasion of Ukraine had “turbo-charged” the shift away from fossil fuels. Contrary to some commentary, the IEA repeats this message again:
“A legacy of the global energy crisis may be to usher in the beginning of the end of the fossil fuel era; the momentum behind clean energy transitions is now sufficient for global demand for coal, oil and natural gas to all reach a high point before 2030 in the STEPS.”
Although the agency does not put precise figures on these “high points” for fossil fuels – presumably due to the uncertainty around the exact timing – Carbon Brief analysis of the IEA’s data shows coal, oil and gas reaching peaks in 2022, 2028 and 2029, respectively.
This would see global demand for all three fossil fuels combined peaking in 2025, as shown by the dark blue line in the figure below. This 2023 policy curve is compared against historical demand for fossil fuels (black), the pre-Paris baseline (grey) and earlier policy settings (shades of blue).
The impact of countries meeting all of their climate pledges as of 2021, 2022 and 2023 are shown by the red curves, while the IEA’s increasingly narrow pathway to 1.5°C is shown in yellow.
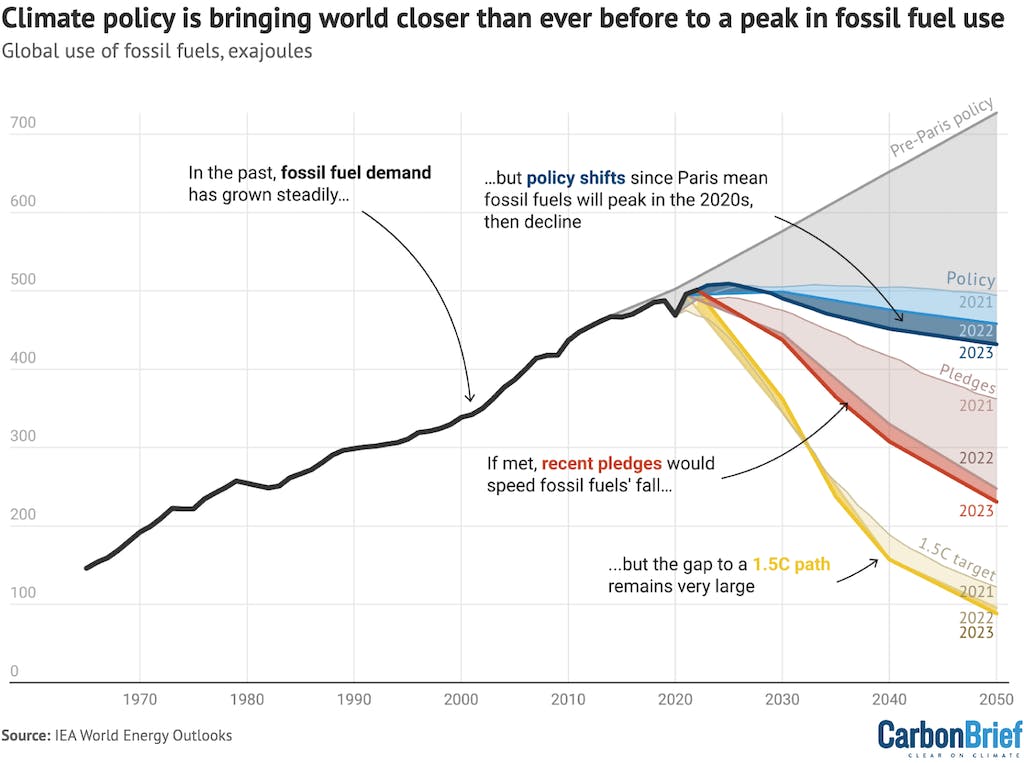
Global use of fossil fuels, exajoules, 1965-2050. Chart shows historical demand (black), the pre-Paris policy baseline (grey, 2015 “current policies scenario”), policy in 2021-2023 (blue, “stated policies scenarios”), as well as pledges in 2021-2023 (red, “announced pledges scenarios”) and the IEA’s suggested paths to staying below 1.5°C in 2021-2023 (yellow, “net-zero emissions by 2050 scenarios”). Source: Carbon Brief analysis by Simon Evans and Verner Viisainen of IEA world energy outlooks 2015-2023. Chart by Tom Prater for Carbon Brief.
The IEA’s assertion that coal, oil and gas will each see peaks in demand this decade has been met with strong pushback from the Opec oil producers’ cartel and some US oil majors.
However, the IEA refers to a range of datapoints in support of its findings, with the rate of new fossil fuel infrastructure being built having already peaked in key areas.
Growth in coal-based steel, cement and electricity generation capacity peaked in 2003, 2010 and 2012, respectively, for example.
Similarly, global sales of combustion-engine cars, motorbikes and trucks peaked in 2017, 2018 and 2019, respectively. Additions of gas power plants peaked in 2002 and sales of gas boilers in 2020.
These are all leading indicators that “set the scene” for declines in coal, oil and gas use later this decade, the outlook says.
Yet the report notes that, under current policy settings, demand for oil and gas would enter a prolonged plateau after peaking this decade. As IEA energy analyst Peter Zeniewski notes on Twitter, “[oil and gas would] still hang around, stubbornly, for decades in the STEPS”.
Even so, the report points to potential for significant “overinvestment” in oil and gas, with current levels of spending “almost double” the amount needed in the IEA’s 1.5°C pathway. It says this “creates the clear risk of locking in fossil fuel use and putting the 1.5°C goal out of reach”.
The outlook goes on to make a thinly veiled reference to certain countries and oil majors, saying their calls for increased oil and gas investment are at odds with the latest market trends.
It says circumstances have changed in recent years, because oil and gas investment has already grown, whereas the outlook for oil and gas demand has shrunk.
As a result, the IEA says its own warnings of oil and gas “underinvestment”, made in previous editions of the outlook, are no longer valid. The report says:
“[T]he fears expressed by some large resource-holders and certain oil and gas companies that the world is underinvesting in oil and gas supply are no longer based on the latest technology and market trends.”
Despite these warnings, the IEA argues that “simply cutting spending on oil and gas will not get the world on track for [1.5°C]”. Instead, it says the “key is to scale up investment in all aspects of a clean energy system to meeting rising demand for energy services in a sustainable way”.
It adds that risks are “weighted more towards overinvestment”:
“Both overinvestment and underinvestment in fossil fuels carry risks for secure and affordable energy transitions…When it comes to the overall adequacy of spending, however, our analysis suggests that the risks are weighted more towards overinvestment than the opposite.”
‘Unstoppable’ clean energy
A major driver of the reduced outlook for fossil fuel growth is the “accelerating” shift to low-carbon technologies, which IEA executive director Dr Fatih Birol says in the report foreword is “moving faster than many people realise”.
This is one of several key distinctions that Birol draws between the current global energy crisis – which is continuing amid heightened geopolitical tensions and conflict in the Middle East – as compared with the 1970s oil crisis 50 years earlier. Birol writes:
“A second difference between the 1970s and today is that we already have the clean energy technologies for the job in hand…Today, solar, wind, efficiency and electric cars are all well established and readily available – and their advantages are only being reinforced by turbulence among the traditional technologies.”
While inflationary pressures have pushed up the cost of low-carbon technologies after many years of rapid decline, the IEA notes that “the prices of all clean energy technologies today are significantly lower than a decade ago [and] they remain competitive with fossil fuel alternatives”.
It adds that there are signs that cost pressures are easing and that technology costs will “continue to trend downward”, although higher borrowing costs “complicate project economics” for now.
Overall, despite all these challenges, the IEA sees a much brighter outlook for low-carbon technologies than it did last year, due to more favourable policies and other factors.
The report lays out the reasons for this brighter outlook, which it says “provides hope for the way forward”. It explains:
“Investment in clean energy has risen by 40 per cent since 2020. The push to bring down emissions is a key reason, but not the only one. The economic case for mature clean energy technologies is strong. Energy security is also an important factor, particularly in fuel-importing countries, as are industrial strategies and the desire to create clean energy jobs.”
As a result, it has once again massively boosted its outlook for global solar growth, with capacity now seen reaching more than 4,000 gigawatts (GW) by 2030 and 12,000GW by 2050, as shown by the red line in the figure below. This is up 56 per cent in 2030 and 69 per cent in 2050 on last year’s outlooks.
Moreover, the IEA’s pre-Paris outlook for global solar capacity of some 1,405GW in 2050 (blue) is set to be passed in 2023, with installations having already reached a total of 1,145GW last year.
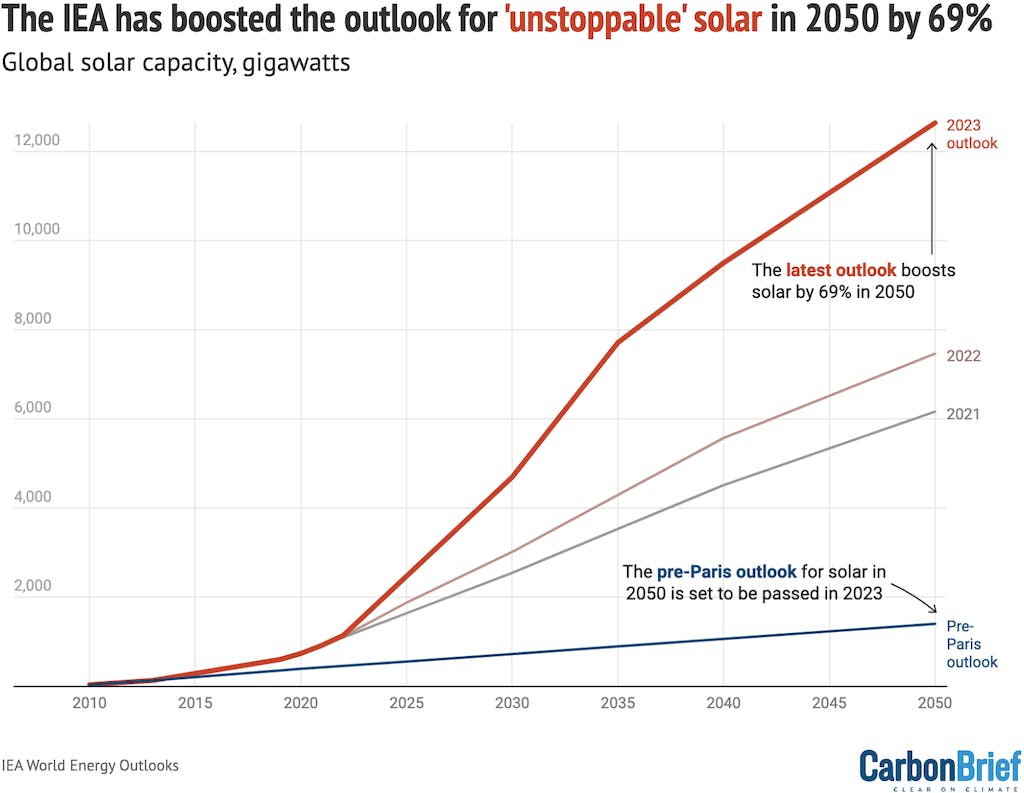
Past and expected future global solar capacity, gigawatts, 2010-2050, in IEA world energy outlooks from 2015 (“new policies scenario”), 2021, 2022 and 2023 (“stated policies scenario”). Chart by Simon Evans for Carbon Brief.
This year’s outlook sees global solar capacity growing by some 344GW in 2023 – more than double the 163GW added in 2021 – with additions reaching nearly 500GW in 2030.
These numbers represent significant upgrades to expected solar growth, for which the IEA has been repeatedly criticised in the past. Nevertheless, the numbers remain well short of projections from BloombergNEF, which expects solar additions to reach more than 700GW in 2030.
This year’s WEO looks at what would happen if solar grows even more quickly – a scenario that it says is supported by ample manufacturing capacity.
In this “NZE solar case”, capacity additions would exceed 800GW in 2030, seen in the figure below. Global use of coal and gas to generate electricity would each be 15 per cent lower than expected under current policy settings – and CO2 emissions in the power sector would also be 15 per cent lower.
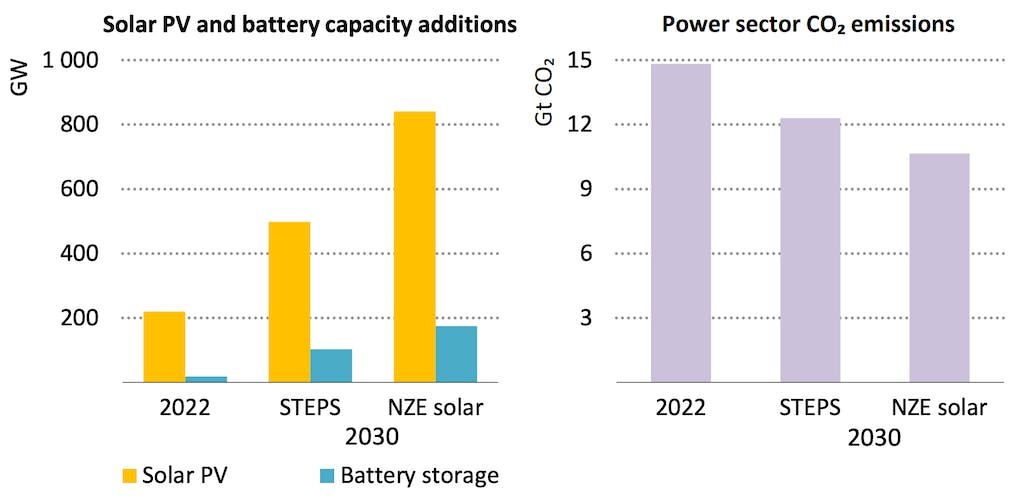
Left panel: Annual global additions of solar (yellow columns) and battery capacity (blue) in 2022 and in 2030 under the main STEPS pathway versus the “NZE solar case”. Right panel: Global CO2 emissions from electricity generation in 2022 and 2030 under the same scenarios. Source: World Energy Outlook 2023.
In order to integrate such large amounts of variable solar generation into electricity networks, the IEA says it would be “crucial” to scale up battery storage capacity to match. It adds:
“Measures to modernise and expand networks, facilitate demand response and boost power system flexibility would also be necessary.”
In a press statement summarising the changed circumstances reflected in this year’s outlook, Birol says the shift to low-carbon technologies is now “unstoppable”:
“The transition to clean energy is happening worldwide and it’s unstoppable. It’s not a question of ‘if’, it’s just a matter of ‘how soon’ – and the sooner the better for all of us.”
Birol goes on to criticise those calling for new investments in oil and gas in the name of energy security, saying such claims “look weaker than ever”. He says:
“Governments, companies and investors need to get behind clean energy transitions rather than hindering them. There are immense benefits on offer, including new industrial opportunities and jobs, greater energy security, cleaner air, universal energy access and a safer climate for everyone. Taking into account the ongoing strains and volatility in traditional energy markets today, claims that oil and gas represent safe or secure choices for the world’s energy and climate future look weaker than ever.”
In addition to boosting the outlook for solar in its main STEPS pathway, the IEA also sees 20 per cent more electric vehicles on the world’s roads and 13 per cent more wind power capacity by 2030.
These changes contribute to the lower fossil fuel demand seen in the preceding section. The IEA sees coal demand in 2050 being 9 per cent lower than expected last year, oil down 6 per cent and gas 3 per cent.
The other major shift since last year’s outlook is the structural changes in China’s economy, where growth is slowing and shifting towards less carbon-intensive sectors.
The outlook gives special attention to this slowdown, which it says is the result of ongoing strains in the Chinese property sector and long-term decline in its working-age population.
The press release accompanying the outlook says these changes will result in a peak and then decline in China’s energy demand and a structural decline for fossil fuels and CO2 emissions:
“China, which has an outsize influence on global energy trends, is undergoing a major shift as its economy slows and undergoes structural changes. China’s total energy demand is set to peak around the middle of this decade, the report projects, with continued dynamic growth in clean energy putting the country’s fossil fuel demand and emissions into decline.”
These changes point to a peak in the nation’s demand for fossil fuels in 2024, as shown by the purple columns turning negative in the chart, below right. After this point, the IEA sees growth in low-carbon sources of energy (green columns) more than covering rising demand.
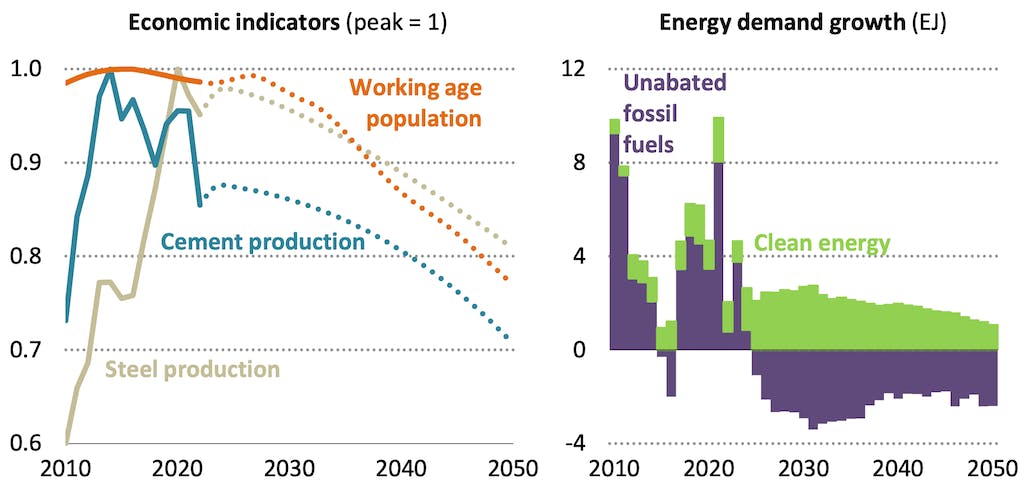
Left panel: Change in selected economic indicators in China relative to their peak levels. Right panel: Annual change in China’s energy demand and the contributions to growth from unabated fossil fuels (purple) and low-carbon sources (green). Source: World Energy Outlook 2023.
In addition to this central case, the IEA also looks at what would happen if China’s economic slowdown goes even further, with “slower but ultimately ‘higher quality’ growth”. In this “low” case, China’s emissions would fall an additional 0.8GtCO2 in 2030 to nearly 15 per cent below 2022 levels.
In an alternative “high” case, China’s emissions would still peak by 2030 – in line with the government’s international climate goal – but at a level 0.8GtCO2 higher than in the central STEPS scenario, due in particular to stronger coal demand.
Clean energy outspending fossil fuels
Global investment in “clean energy”, at US$1.8tn in 2023, is already nearly twice as high as fossil fuel spending (US$1tn), the IEA says, as shown in the leftmost column in the figure below.
The IEA expects this disparity to grow over the coming decades. Clean energy would outspend fossil fuels by 2.5 times in 2030 under current policy settings (STEPS).
If countries get on track to stay below 1.5°C (NZE), then clean energy spending would reach US$4.3tn in 2030, while fossil fuel investment would fall 60 per cent to just US$0.4tn, some 10 times lower.
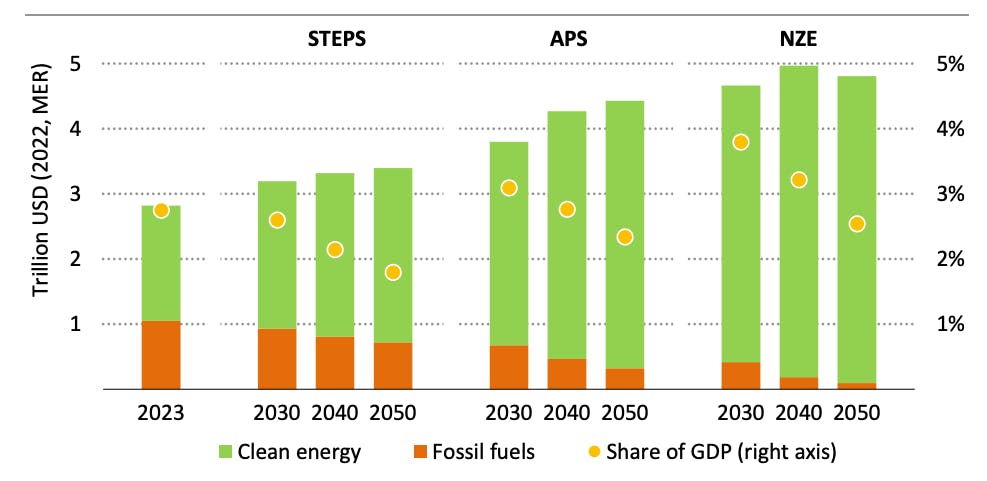
Investment in energy, in $tn (columns, left axis) and as a share of global GDP ( per cent, yellow circles, right axis). Source: World Energy Outlook 2023.
Although the shift towards net-zero would require significant upfront capital spending, the IEA figures show that the extra investment would only amount to around 1 per cent of global GDP.
Moreover, much of this extra investment would be paid back in lower running costs, with fossil fuel importing countries such as the UK and China also benefiting from lower trade deficits and increasing energy security. The report explains:
“The large increase in capital investment in the NZE scenario is partly compensated for by lower operating costs that follow the shift away from fossil fuels towards capital-intensive clean technologies. For fossil fuel importing countries, the shift towards clean energy also improves trade balances and enhances energy security as the share of energy met through domestically sourced renewables starts to rise.”
‘Very difficult’ path to 1.5°C
The IEA says current government policies in the STEPS pathway would peak global CO2 emissions by 2025, sufficient to keep global warming to 2.4C by 2100.
This is a significant improvement on the 3.5C of warming it expected under the policies in place before the Paris Agreement. Moreover, warming would be limited to 1.7C if all countries meet their near- and longer-term climate pledges and net-zero targets, the agency says.
Yet this would still leave a significant gap to staying below 1.5°C, a path that the IEA says is “very difficult – but remains open”.
The outlook reiterates the agency’s five ideas for keeping the door to 1.5°C open at COP28, which it has been promoting all year – and some of which have been taken up by the COP28 presidency.
Its suggested targets are that by 2030, the world should: triple the capacity of renewable energy sources to 11,000GW; double the annual rate of energy efficiency improvements to 4 per cent; and cut methane emissions from fossil fuel extraction by 75 per cent, as shown in the figure below.
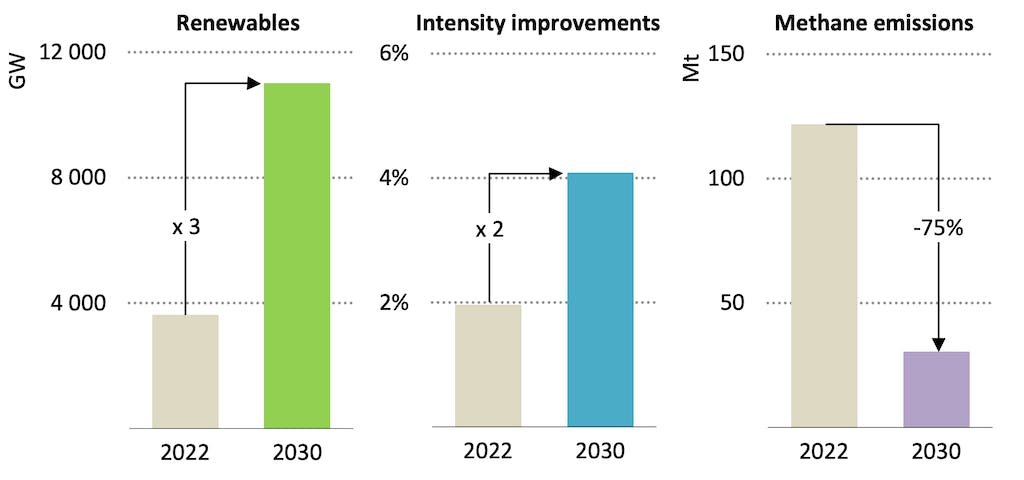
Left: Global renewable energy capacity, gigawatts. Centre: Annual rate of improvement in the energy intensity of the global economy - the rate of energy use per unit of GDP. Right: Global energy sector methane emissions, million tonnes. Source: World Energy Outlook 2023.
These “mature, tried and tested, and in most cases very cost effective” actions would provide more than 80 per cent of the emissions cuts needed by 2030 to get on track for 1.5°C, the IEA says.
In order to achieve these goals, the IEA says there will be a need for “innovative, large-scale financing mechanisms” to support low-carbon investments in emerging and developing countries.
It also calls for “measures to ensure an orderly decline in the use of fossil fuel” such as ending the approval of new unabated coal power plants.
Finally, the IEA notes that there is “noticeably less reliance on early-stage technologies to reach net-zero emissions” in this year’s outlook as compared with 2021. It explains:
“At that time, technologies not available on the market, ie at prototype or demonstration phase, delivered nearly 50 per cent of the emissions reductions needed in 2050 to reach net-zero. Now that number is around 35 per cent.”
Analysis of the WEO was conducted by Carbon Brief’s Simon Evans and Verner Viisainen.


