
The new sector-by-sector analysis for Carbon Brief, based on official figures, industry data and analyst reports, illustrates the huge surge in investment in Chinese clean energy last year – in particular, the so-called “new three” industries of solar power, electric vehicles (EVs) and batteries.
Solar power, along with manufacturing capacity for solar panels, EVs and batteries, were the main focus of China’s clean-energy investments in 2023, the analysis shows.
(For this analysis, we used a broad definition of “clean energy” sectors, including renewables, nuclear power, electricity grids, energy storage, EVs and railways. These are technologies and infrastructure needed to decarbonise China’s production and use of energy.)
Other key findings of the analysis include:
- Clean-energy investment rose 40 per cent year-on-year to 6.3tn yuan (US$890bn), with the growth accounting for all of the investment growth across the Chinese economy in 2023.
- China’s US$890bn investment in clean-energy sectors is almost as large as total global investments in fossil fuel supply in 2023 – and similar to the GDP of Switzerland or Turkey.
- Including the value of production, clean-energy sectors contributed 11.4tn yuan (US$1.6tn) to the Chinese economy in 2023, up 30 per cent year-on-year.
- Clean-energy sectors, as a result, were the largest driver of China’ economic growth overall, accounting for 40 per cent of the expansion of GDP in 2023.
- Without the growth from clean-energy sectors, China’s GDP would have missed the government’s growth target of “around 5 per cent”, rising by only 3.0 per cent instead of 5.2 per cent.
The surge in clean-energy investment comes as China’s real-estate sector shrank for the second year in a row. This shift positions the clean-energy industry as a key part not only of China’s energy and climate efforts, but also of its broader economic and industrial policy.
However, the spectre of overcapacity means China’s clean-energy investment growth – and its investment-driven economic model, in general – cannot continue indefinitely.
The growing importance of these new industries gives China a significant economic stake in the global transition to clean-energy technologies.
Yet it also poses questions for overseas policymakers attempting to tie their own climate strategies to domestic industrial growth.
Clean energy drives China’s growth in 2023
China’s clean-energy investment boom means the sector accounted for all of the growth in investment across the country’s economy in 2023, with spending in other areas shrinking.
China invested an estimated 6.3tn yuan (US$890bn) in clean-energy sectors in 2023, up from 4.6tn yuan in 2022, a 1.7tn yuan (40 per cent) year-on-year increase. In total, clean energy made up 13 per cent of the huge volume of investment in fixed assets in China in 2023, up from 9 per cent a year earlier.
With Chinese investment growing by just 1.5tn yuan in 2023 overall, the analysis shows that clean energy accounted for all of the growth, while investment in sectors such as real estate shrank.
This is shown in the figure below, which also highlights the concentration of clean-energy investment in the so-called “new three” of solar, energy storage and EVs.
Clean energy was also the top contributor to China’s economic growth overall, contributing around 40 per cent of the year-on-year increase in GDP across all sectors.
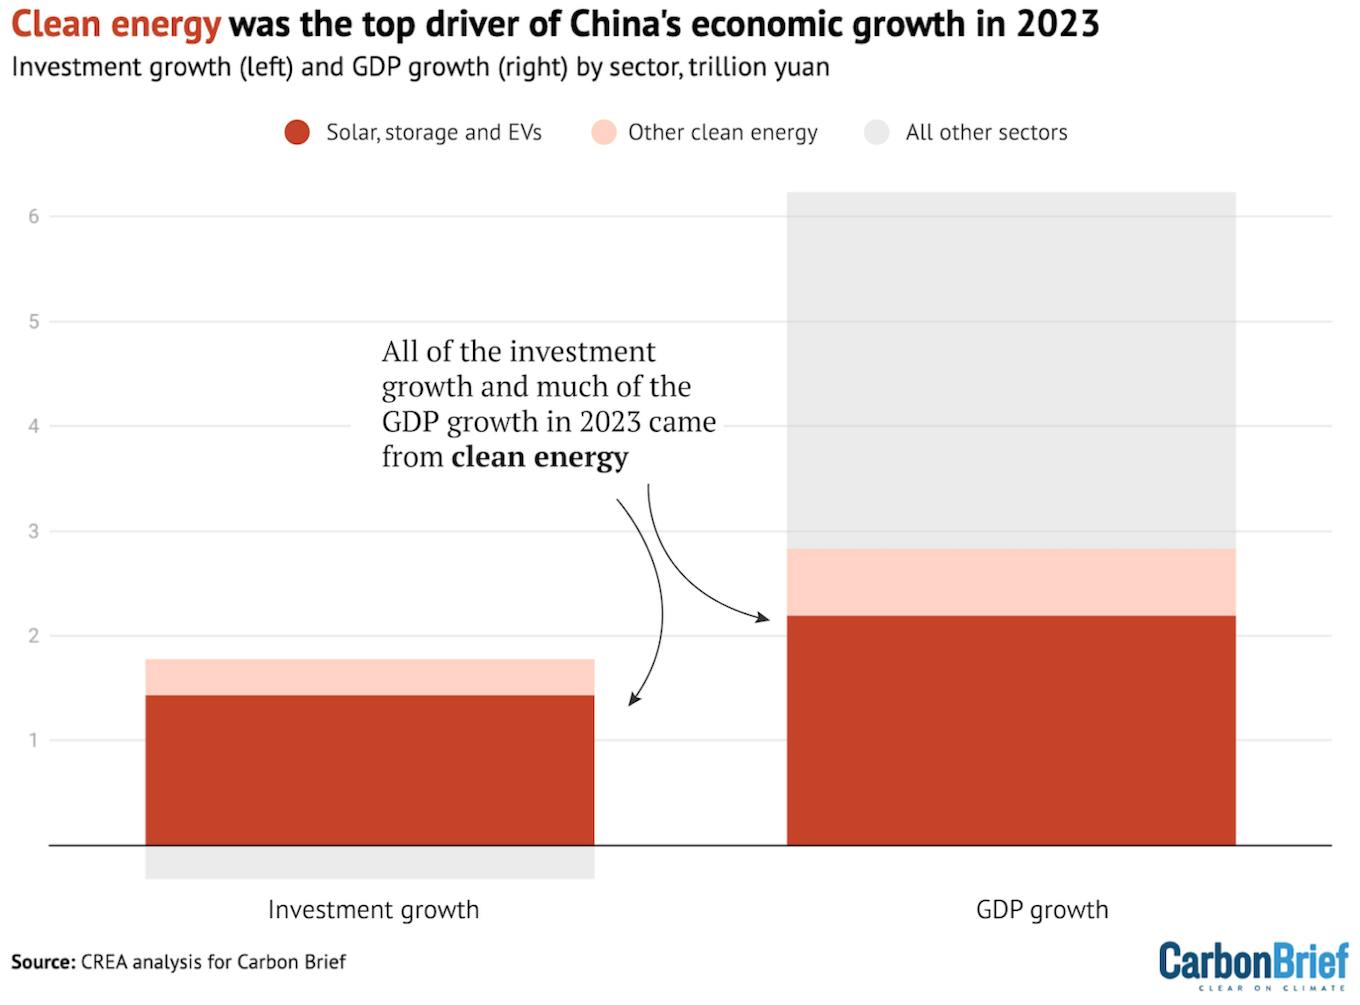
Contributions to the growth in Chinese investment (left) and GDP overall (right) in 2023 by sector, trillion yuan. “New three” refers to solar, EVs and storage. Source: Centre for Research on Energy and Clean Air (CREA) analysis for Carbon Brief. Chart by Carbon Brief.
Including the value of goods and services, the clean-energy sector contributed an estimated 11.4tn yuan (US$1.6tn) to China’s economy in 2023, an increase of 30 per cent year-on-year.
This means clean energy accounted for 9.0 per cent of China’s GDP in 2023, up from 7.2 per cent in 2022.
Without the contribution of clean-energy sectors to China’s economic growth in 2023, the country would have seen its GDP rise by just 3.0 per cent, instead of the 5.2 per cent actually recorded.
This would have missed government growth targets at a time of increasing concerns over the nation’s economic prospects, amid the ongoing real-estate crisis and declining population.
The major role that clean energy played in boosting growth in 2023 means the industry is now a key part of China’s wider economic and industrial development.
This is likely to bolster China’s climate and energy policies – as well as its “dual carbon” targets for 2030 and 2060 – by enhancing the economic and political relevance of the sector.
The ‘new three’ dominate clean-energy investment
This analysis is based on a combination of government releases, industry data and analyst reports, with the exact methodology varying sector-by-sector, as set out in the sections that follow.
The table below lists the estimated contributions of each sector to Chinese investment and GDP overall in 2023, as well as the year-on-year growth since 2022.
The analysis includes solar, EVs, energy efficiency, rail, energy storage, electricity grids, wind, nuclear and hydropower within the broad category of “clean-energy sectors”. All of these are technologies and infrastructure needed to decarbonise China’s energy supply and consumption.
The so-called “new three” of solar, storage and EVs are all prominent in the table – and all recorded strong growth.
Our analysis shows that investment in clean power generation and energy storage capacity reached 1.7tn yuan in 2023 (up 48 per cent year-on-year), while investment in manufacturing capacity for solar, EVs and batteries reached 2.5tn yuan (+60 per cent).
Investment in clean-energy infrastructure reached 1.4tn yuan (+9 per cent, comprising grids, EV charging points and railways) and investment in energy efficiency was 600bn yuan (+15 per cent).
Meanwhile, our analysis shows the value of production of goods and services in the clean-technology sectors reached 5.1tn yuan in 2023, increasing 26 per cent year-on-year.
This includes the value of electricity generation, EV sales and solar exports, as well as the transport of passengers and goods via rail.
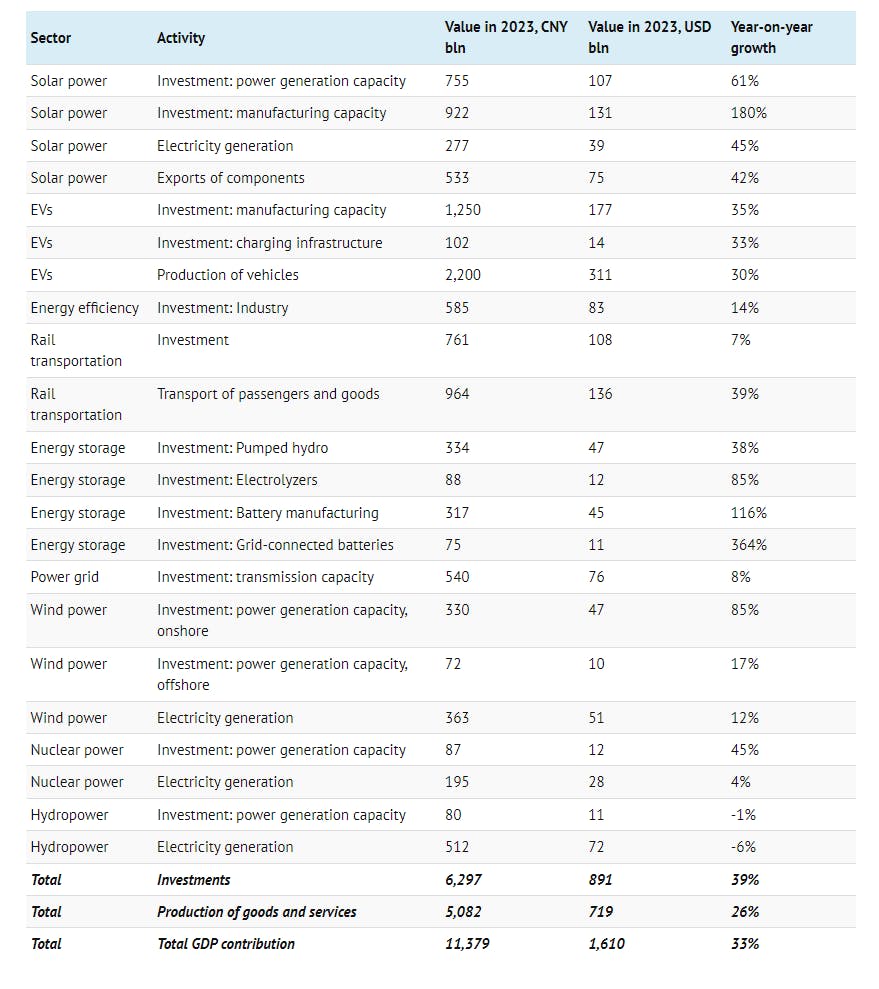
Chart by Carbon Brief.
Solar power
Solar was the largest contributor to growth in China’s clean-technology economy in 2023. It recorded growth worth a combined 1tn yuan of new investment, goods and services, as its value grew from 1.5tn yuan in 2022 to 2.5tn yuan in 2023, an increase of 63 per cent year-on-year.
While China has dominated the manufacturing and installations of solar panels for years, the growth of the industry in 2023 was unprecedented.
On the installation side, two major central government initiatives drove increased volumes, namely the “whole-county distributed solar” and the “clean energy base” programmes.
In addition, in response to the slowdown in the real-estate sector, the central government introduced a new policy at the start of 2023, to encourage the development of solar power industries on unused and existing construction lands.
Meanwhile, during the annual legislative meetings in the spring of 2023, 15 provinces prioritised solar industry development in their government work agendas.
Detailed data on the growth in China’s solar installations in the first 11 months of the year is shown in the figure below. (An estimated 200GW was added across the country during 2023 as a whole, more than doubling from the record of 87GW set in 2022.)
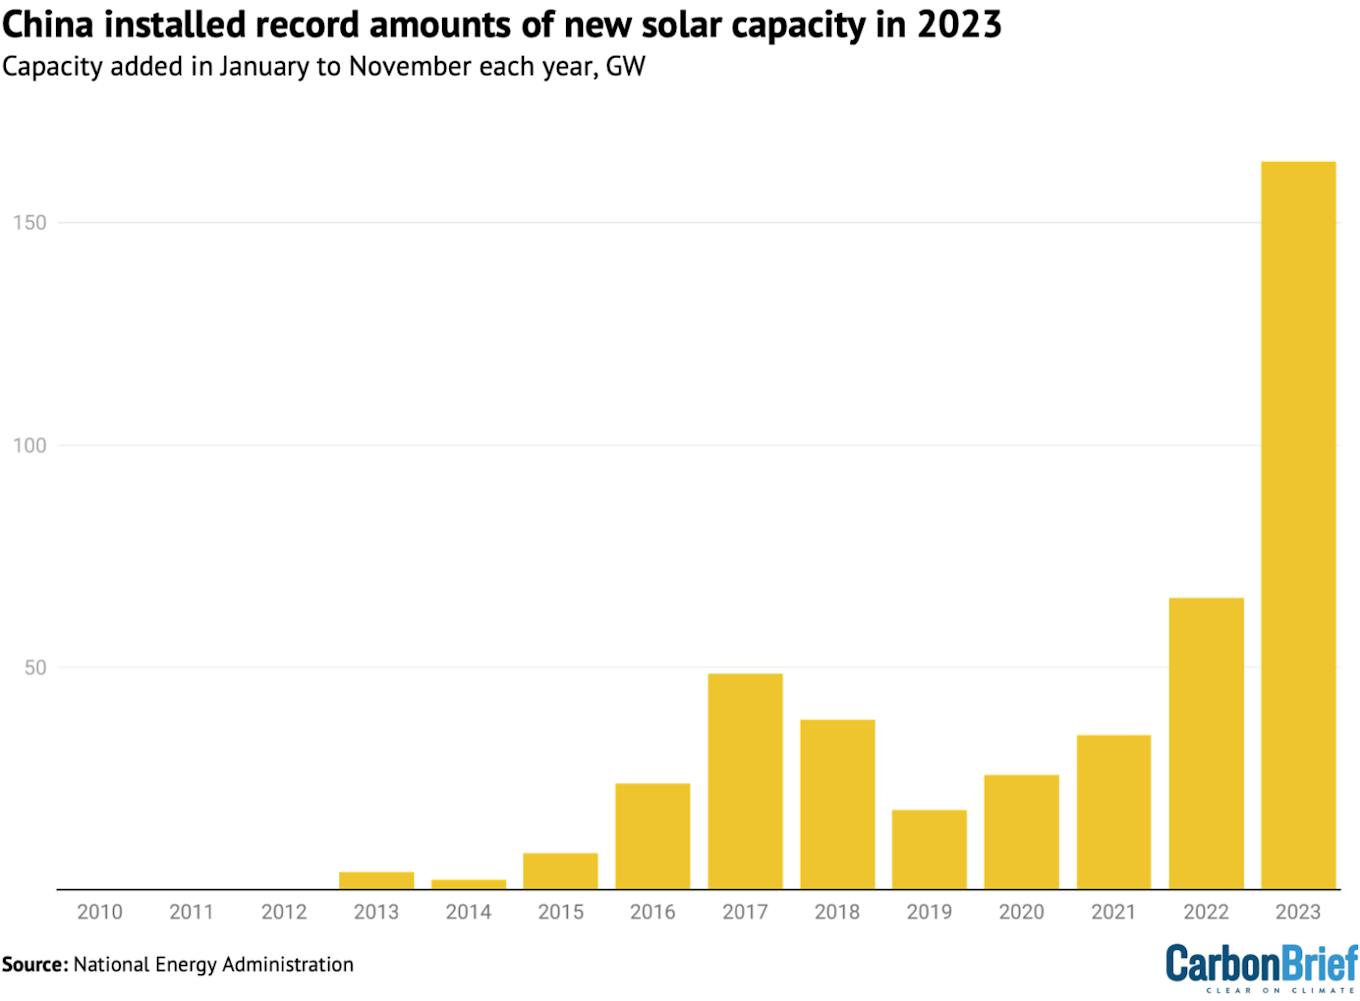
Solar capacity newly installed in China in January to November each year, gigawatts. Source: National Energy Administration. Chart by Carbon Brief.
At the same time, China’s solar manufacturing industry recorded even stronger growth in 2023. China added 340 gigawatts (GW) of polysilicon production capacity and 300GW of wafer, cell and module production capacity in 2023, according to the International Energy Agency (IEA).
China experienced a significant increase in solar product exports in 2023. It exported 56GW of solar wafers, 32GW of cells and 178GW of modules in the first 10 months of the year, up 90 per cent, 72 per cent and 34 per cent year-on-year respectively, according to the China Photovoltaic Industry Association. However, due to falling costs, the export value of these solar products only increased by 3 per cent.
Within the overall export growth there were notable increases in China’s solar exports to countries along the “belt and road”, to southeast Asian nations and to several African countries.
For this analysis, the value of investments in new solar manufacturing capacity was estimated from the average capital costs of each step in the supply chain, taken from a compilation of reported project costs. This gave a significantly lower cost level than reported in other literature.
The analysis assumes that local government investment in facilities and infrastructure, as well as direct subsidies, added 30 per cent to the reported private investment.
Investment in solar power was estimated by multiplying the newly added capacity from Bloomberg New Energy Finance by the unit investment costs for rooftop and utility-scale systems from China Photovoltaic Industry Association.
The value of exported solar power equipment was based on China Photovoltaic Industry Association data for 2022 and reported export growth for 2023.
The value of solar power equipment produced for domestic installation was not included in our analysis, to avoid overlap with the already-estimated investment costs for domestic solar projects.
Wind power
China installed 41GW of wind power capacity in the first 11 months of 2023, an increase of 84 per cent year-on-year in new additions. Some 60GW of onshore wind alone was due to be added across 2023, according to China Galaxy Securities, based on trends in previous years.
In addition, offshore wind capacity increased by 6GW across the whole of 2023.
Wind capacity added in the first 11 months of each year is shown in the figure below.
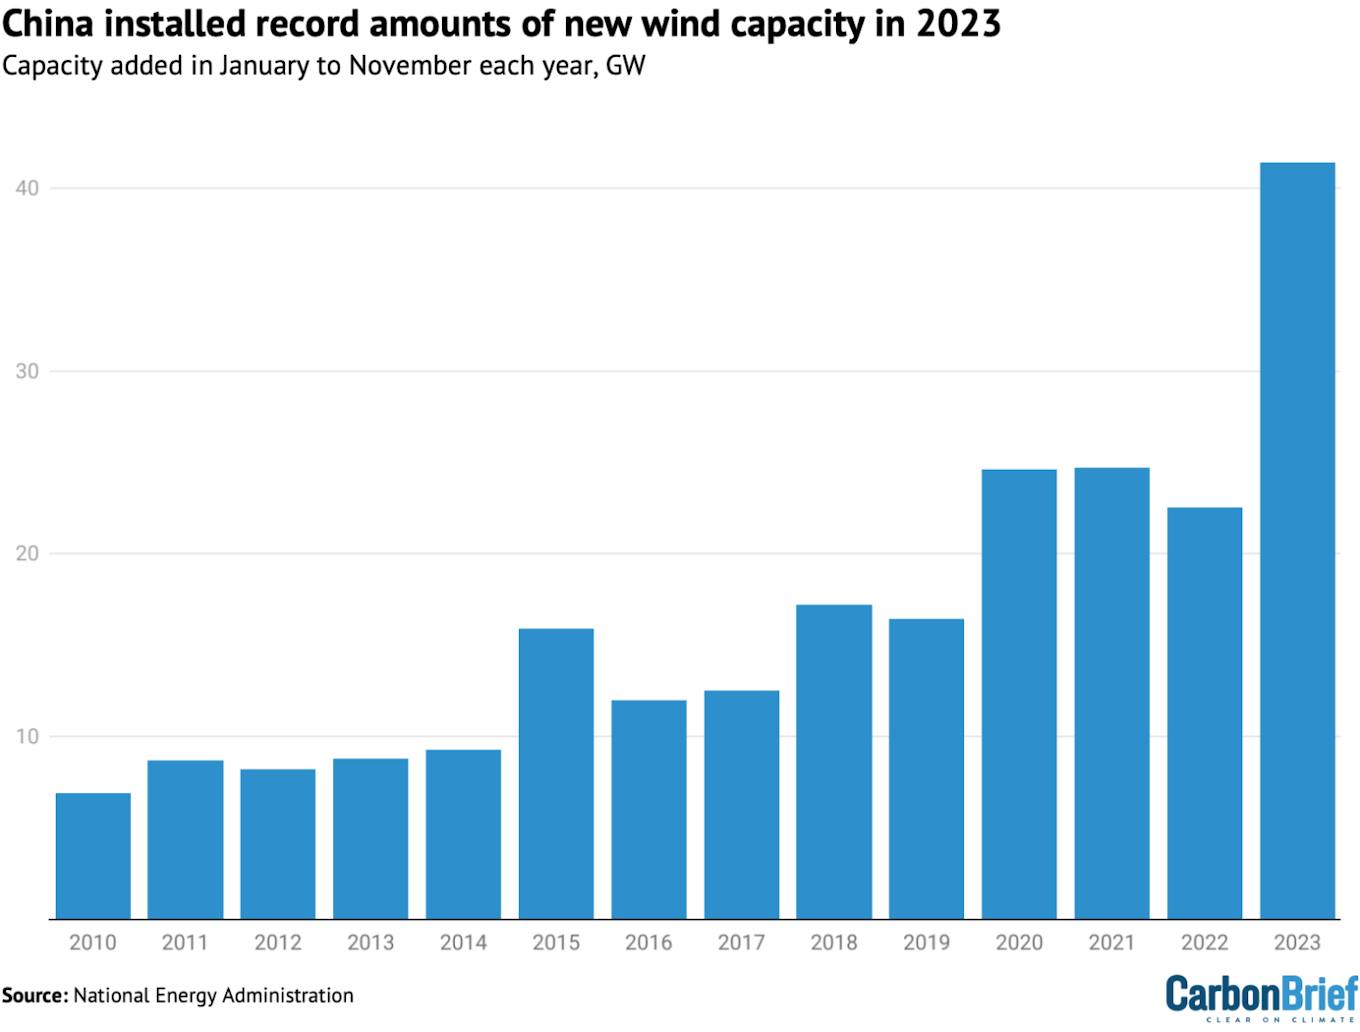
Wind capacity newly installed in China in January to November each year, gigawatts. Source: National Energy Administration. Chart by Carbon Brief.
By the end of 2023, the first batch of “clean-energy bases” were expected to have been connected to the grid, contributing to the growth of onshore wind power, particularly in regions such as Inner Mongolia and other northwestern provinces. The second and third batches of clean-energy bases are set to continue driving the growth in onshore wind installations.
The market is also being driven by the “repowering” of older windfarms, supported by central government policies promoting the model of replacing smaller, older turbines with larger ones.
The potential for distributed wind power is also being explored, with initiatives such as the “villages wind utilisation action” being planned for active implementation.
Progress on offshore wind power construction in 2023 got off to a slow start. This is a reflection of a shift from nearshore to deeper offshore projects and from single projects to larger bases.
Offshore wind projects are also facing complex approval processes, involving multiple regulatory aspects, leading to uncertainties and slower-than-expected installations.
However, these issues are being addressed and the fourth quarter of 2023 saw a rebound in offshore wind construction, with 2024 expected to be a significant year for project deliveries.
Since 2021, new wind projects in China no longer receive subsidies from the central government.
Despite technological advancements reducing costs, increases in raw material prices have resulted in lower profit margins compared to the solar industry, leading to a smaller overall investment in wind power relative to solar power.
Electric vehicles
China’s production of electric vehicles grew 36 per cent year-on-year in 2023 to reach 9.6m units, a notable 32 per cent of all vehicles produced in the country.
The vast majority of EVs produced in China are sold domestically, with sales growing strongly despite the phase-out of purchase subsidies announced in 2020 and completed at the end of 2022.
The national purchase subsidy for EVs was a central government finance instrument that had been fostering the EV market for 13 years. Its demise highlights a gradual shift from policy-driven to market-driven demand, making growth more likely to be sustained.
Sales of EVs made in China reached 9.5m units in 2023, a 38 per cent year-on-year increase. Of this total, 8.3m were sold domestically, accounting for one-third of Chinese vehicle sales overall, while 1.2m EVs were exported, a 78 per cent year-on-year increase.
The growth of “new energy vehicle” (NEV, mainly EVs) production and sales is shown in the figure below, which also shows their rising share of all vehicles sold.
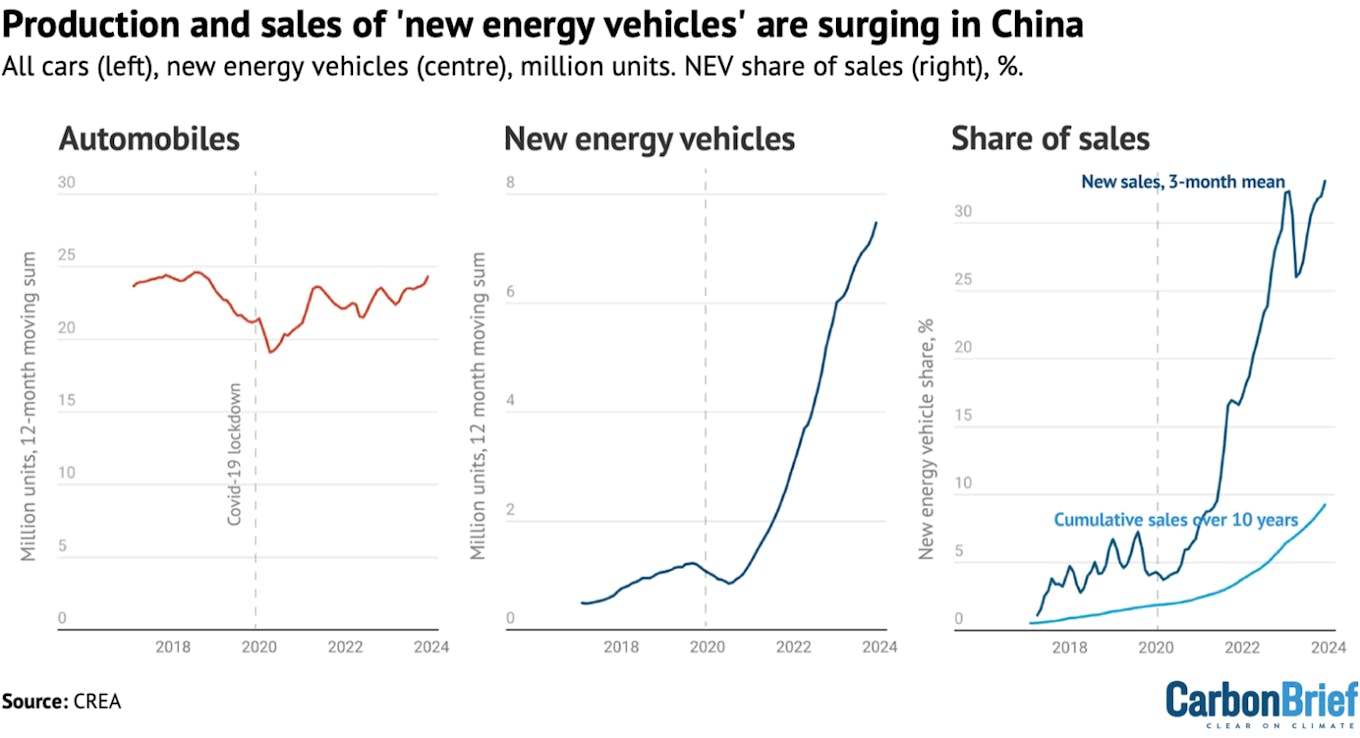
Production and sales of all vehicles and “new energy vehicles” (NEVs) in China, from National Bureau of Statistics and China Association of Automobile Manufacturers data via Wind Financial Terminal. NEVs include battery electric vehicles and plug-in hybrids. The right-hand side shows the share of NEVs out of all new vehicles sold, and the cumulative share over the preceding 10 years, as an indicator of the share of NEVs out of vehicles on the road. Chart by Carbon Brief.
China’s EV market is highly competitive, with at least 94 brands offering more than 300 models. Domestic brands account for 81 per cent of the EV market, with BYD, Wuling, Chery, Changan and GAC among the top players.
Sustaining this growth has required major investment in manufacturing capacity.
This analysis estimates investments in EV manufacturing capacity based on a study by China International Association for Promotion of Science and Technology (CIAPST), which put investment in EV manufacturing at 0.7tn yuan in 2021.
The analysis assumes that EVs accounted for all of the growth in investment in vehicle manufacturing capacity reported by China’s national bureau of statistics (NBS) in 2022 and 2023, while investment in conventional vehicles was stable
This implies that investment in EV manufacturing reached CNY 1.2tn yuan in 2023. This is likely to be conservative, because production volumes for combustion engine vehicles are falling, implying a corresponding fall in investment.
This analysis accounts for the expansion of battery manufacturing capacity separately – alongside electricity storage – even though it is being driven by the growth in EV production.
The analysis estimates the value of EV production, including both domestic sales and exports, based on vehicle production volumes from NBS and the reported average EV price.
These EV prices include the value of batteries produced for EVs, so the value of battery production is not included separately.
Meanwhile, EV charging infrastructure is expanding rapidly, enabling the growth of the EV market. In 2022, more than 80 per cent of the downtown areas of “first-tier” cities – megacities such as Beijing, Shanghai and Guangzhou – had installed charging stations, while 65 per cent of the highway service zones nationwide provided charging points.
More than 3m new charging points were put into service during 2023, including 0.93m public and 2.45m private chargers. The accumulated total by November 2023 reached 8.6m charging points.
This analysis puts investment in EV charging infrastructure at 0.1tn yuan in 2023, based on an estimated average cost of 30,000 yuan per charging point.
Energy efficiency
China’s energy intensity reduction targets have put pressure on industries to reduce their energy use per unit of output, spurring investment in more efficient processes.
For this analysis, the size of the market for energy service companies is used as a proxy for investment in energy efficiency in industries and buildings. This market grew to an estimated 0.6tn yuan in 2023, up from 0.5tn yuan in 2022, based on the revenue growth of the top 10 listed energy service companies ranked by market capitalisation, for the first two or three quarters of 2023.
Over the past two decades, China’s energy service sector has experienced rapid expansion, growing from 1.8bn yuan in 2003 to 607bn yuan in 2021. Investment in the industrial service sector has been a key driver, accounting for about 60 per cent of the total investment.
However, 2022 saw a significant downturn in the industrial energy service output, influenced by poor industrial growth, even though the building service sector continued expanding.
This analysis puts China’s investment in building energy efficiency at 80bn yuan per year. The country’s 14th five-year plan for energy savings in buildings and development of “green buildings” targets 80m square metres per year of renovated and newly built green buildings.
Compared with the almost 1,000m square metres of building space completed annually, this is a small percentage, and accordingly, the estimated value of total investments is modest.
Electricity storage and hydrogen
China is rapidly scaling up electricity storage capacity. This has the potential to significantly reduce China’s reliance on coal- and gas-fired power plants to meet peaks in electricity demand and to facilitate the integration of larger amounts of variable wind and solar power into the grid.
The construction of pumped hydro storage capacity increased dramatically in the last year, with capacity under construction reaching 167GW, up from 120GW a year earlier.
This growth is illustrated in the figure below, which shows pumped hydro capacity under construction or in earlier stages of development at the end of 2023.
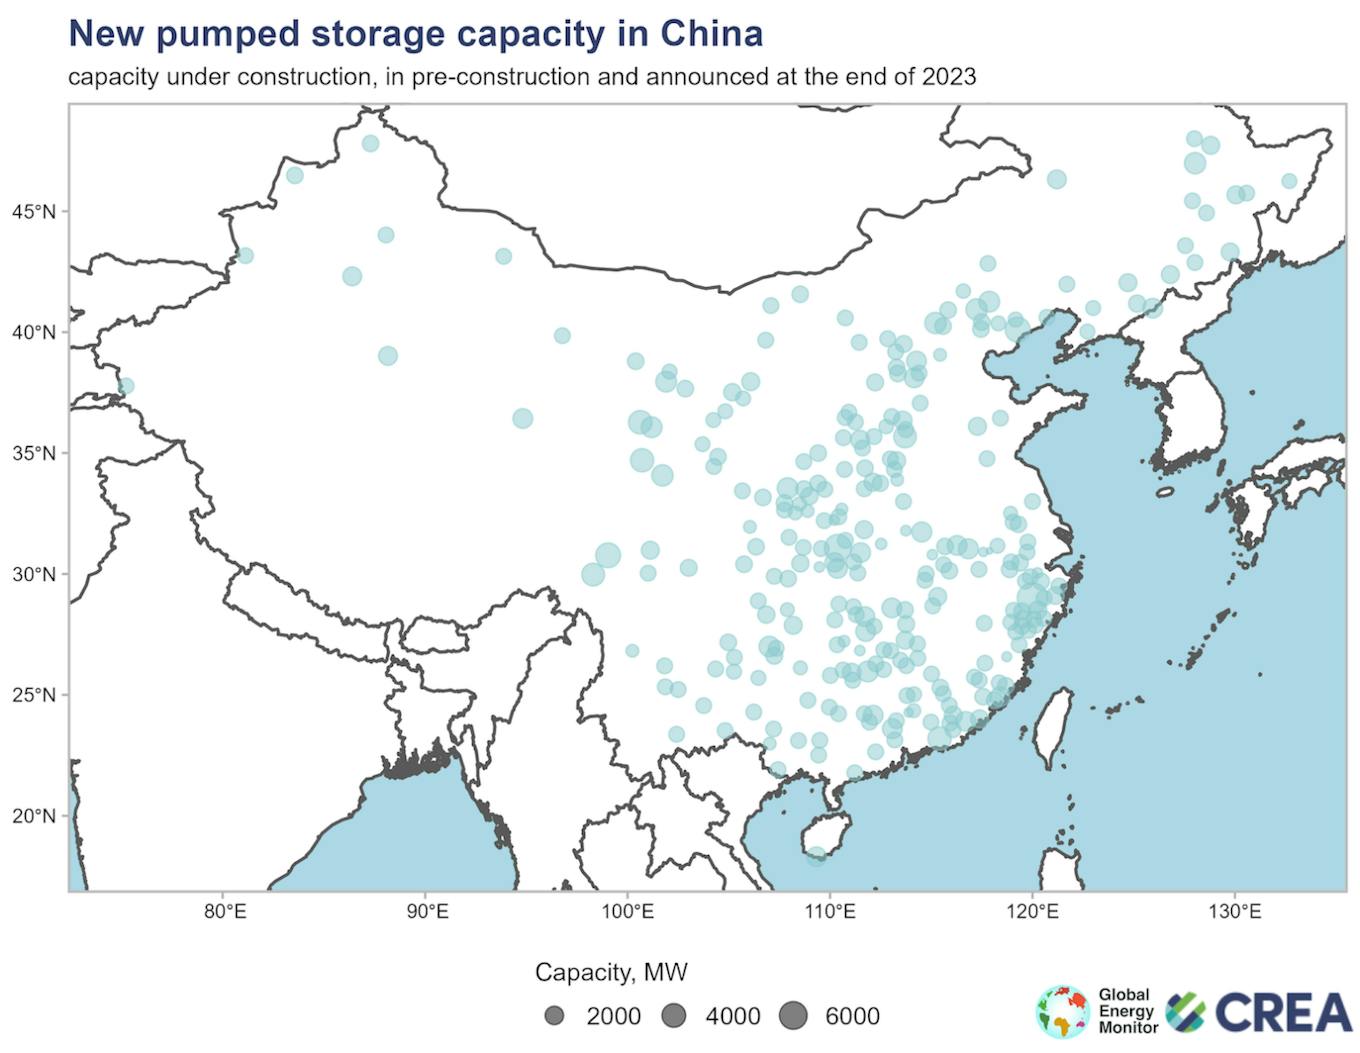
Capacity of pumped hydro storage projects under construction or in earlier stages of development at the end of 2023, GW. Source: Global Energy Monitor global hydropower tracker.
Data from Global Energy Monitor identifies another 250GW in pre-construction stages, indicating that there is potential for the current surge in capacity to continue.
For this analysis, estimated annual investments in pumped storage are assumed to be proportional to the capacity under construction, while the reported construction cost of 6 yuan per watt is spread over three years. This implies that investment in 2023 amounted to 0.3tn yuan.
Construction of new battery manufacturing capacity was another major driver of investments, estimated at 0.3tn. This is based on the added capacity reported by the China Automotive Power Battery Industry Innovation Alliance and estimated average investment costs per unit of production capacity, taken from a compilation of publicly reported project costs.
Investment in electrolysers for “green” hydrogen production almost doubled year-on-year in 2023, reaching approximately 90bn yuan, based on estimates for the first half of the year from SWS Research. Analyst reports and compilations of projects published in news media put far larger numbers on China’s investments in green hydrogen, but these generally include the spending on electricity generation, which in this analysis is accounted for separately.
Investment in “new energy storage technologies” – a classification dominated by batteries – more than doubled in 2023, reaching 75bn yuan. This estimate is based on newly added capacity in 2023 reported by China Energy Storage Alliance and average investment costs calculated from National Energy Administration data.
Railways
China’s ministry of transportation reported that investment in railway construction increased 7 per cent in January–November 2023, implying investment of 0.8tn for the full year. This includes major investments in both passenger and freight transport. Investment in roads fell slightly, while investment in railways overall grew by 22 per cent.
The share of freight volumes transported by rail in China has increased from 7.8 per cent in 2017 to 9.2 per cent in 2021, thanks to the rapid development of the railway network.
In 2022, some 155,000km of rail lines were in operation, of which 42,000km were high-speed. This is up from 146,000km of which 38,000km were high-speed in 2020.
The value of passenger and freight transportation on China’s railways increased by 39 per cent year-on-year in 2023, reaching nearly 1tn yuan.
Nuclear power
In 2023, 10 nuclear power units were approved in China, exceeding the anticipated rate of 6-8 units per year set by the China Nuclear Energy Association in 2020 for the second year in a row.
There are 77 nuclear power units that are currently operating or under construction in China, the second-largest total in the world. The total yearly investment in 2023 was estimated for this analysis at 87bn yuan, an increase of 45 per cent year-on-year, based on data for January–November from the National Energy Administration.
The highest numbers of nuclear projects are located in coastal provinces with large concentrations of heavy industry, such as Guangdong, Fujian and Zhejiang, as the development of inland nuclear power projects remains stalled.
These provinces get around 20 per cent of their electricity from nuclear power and continue to expand the technology as part of their efforts to cut emissions from their power sectors.
Electricity grids
China’s power-sector development plans include a major increase in inter-provincial electricity transmission capacity and numerous long-distance transmission lines from west to east.
State Grid, the government-owned operator that runs the majority of the country’s electricity transmission network, has a target to raise inter-provincial power transmission capacity to 300GW by 2025 and 370GW by 2030, from 230GW in 2021. These plans play a major role in enabling the development of clean energy bases in western China.
China Electricity Council reported investments in electricity transmission at 0.5tn yuan in 2023, up 8 per cent on year – just ahead of the level targeted by State Grid.
Why clean energy took off in 2023
The clean-energy investment boom in 2023 is the outcome of a major pivot in China’s macroeconomic strategy. As this analysis shows, investment flowed from real estate into manufacturing – primarily in the clean-energy sector.
Total investment in the manufacturing industry increased by 9 per cent year-on-year in 2023, while investment in the power and heat sectors climbed 23 per cent. These increases were entirely due to growth in investment in clean energy, with investment in other areas falling. Therefore, China’s pivot into manufacturing was, in reality, a pivot to cleantech manufacturing.
The reason for this pivot was the contraction in the real-estate sector, where investment fell by 10 per cent year-on-year in 2022 and another 9 per cent in 2023. While this drop was in line with the government’s aim to address financial risks and excess leverage in the sector, it left a major hole in aggregate investment demand and in the revenue of China’s local governments.
Local governments were under pressure to attract investment, meaning that they offered generous subsidies and helped arrange financing.
The central government, for its part, eased private-sector access to financial markets and bank loans during the Covid-19 pandemic, facilitating the growth of the clean-energy sector.
Unlike the state-owned firms dominating traditional industries, the low-carbon sector, largely composed of private companies, gained access to previously constrained credit.
The significance of this economic shift is reflected not only in the figures revealed by this analysis but also in the language being used by Chinese media.
The three largest of clean-energy sectors by value, namely solar, storage and EVs, are being referred to as the “new three”, in contrast to the “old three” – clothing, home appliances and furniture.
This pivot was only possible because China’s clean-energy policies and wider industrial policy had built the foundation and scaled up these sectors so that they were primed for rapid growth.
The post-Covid credit “push” for clean energy growth also coincided with a demand “pull”, driven by falling costs and the increased competitiveness of low-carbon technologies against fossil fuels due to technological advancements.
Moreover, the announcement in 2020 of the 2060 carbon neutrality target had raised expectations and provided the political signal for the scale-up.
What clean-energy growth means for China – and the world
Clean technology has been an important part of China’s energy policy, industrial strategy and climate change efforts for a long time. Last year marked the first time that the sector also became a key economic driver for the country. This has important implications.
China’s reliance on the clean-technology sectors to drive growth and achieve key economic targets boosts their economic and political importance. It could also support an accelerated energy transition.
The massive investment in clean technology manufacturing capacity and exports last year means that China has a major stake in the success of clean energy in the rest of the world and in building up export markets.
For example, China’s lead climate negotiator Su Wei recently highlighted that the goal of tripling renewable energy capacity globally, agreed in the COP28 UN climate summit in December, is a major benefit to China’s new energy industry. This will likely also mean that China’s efforts to finance and develop clean energy projects overseas will intensify.
Globally, China’s unprecedented clean-energy manufacturing boom has pushed down prices, with the cost of solar panels falling 42 per cent year-on-year – a dramatic drop even compared to the historical average of around 17 per cent per year, while battery prices fell by an even steeper 50 per cent.
This, in turn, has encouraged much faster take-up of clean-energy technologies.
Projections of solar power deployment, in particular, have been upended. The IEA’s latest World Energy Outlook introduced an additional global energy scenario just to look at the implications, projecting that if global deployment of solar power and grid-connected batteries follows the expansion of manufacturing capacity, then global power-sector coal use and carbon dioxide emissions could be a sizable 15 per cent lower than in the base case by 2030. Most of the additional deployment of solar in the IEA’s revised projections is in China.
Even with the increased deployment, however, there is a limit to how much solar power, batteries and other clean technology can be absorbed, as the manufacturing expansion has already saturated most of the global market.
This means that the expansion will run into overcapacity, if maintained. On the other hand, in order to keep driving growth in investment, clean-technology manufacturing would need to not only absorb as much capital as it did in 2023, but keep increasing investment year after year.
The clean-technology investment boom has provided a new lease of life to China’s investment-led economic model. There are new clean-energy technologies where there is scope for expansion, such as electrolysers.
Eventually, however, entirely new sectors will have to be found for investment – or China’s economic model will have to be transformed once there is nowhere left for investment to flow.
The manufacturing boom also cements China’s dominant position in clean-energy supply chains. Other countries therefore face a choice of whether they want to benefit from the low-cost supply of solar panels, batteries, EVs and other clean-energy technology from China.
The alternative is diversifying their supply and paying the cost of building new supply chains, in the form of subsidies and import tariffs required to enable domestic producers or producers in third countries to compete against Chinese suppliers. Such efforts would further increase supply and push down global prices even further.
This story was published with permission from Carbon Brief.


