
The paper, published in Nature Communications, assesses the link between extreme temperatures and human mortality in more than 700 cities and small-scale regions around the world.
The risk of heat-related deaths during extreme summer heat has already “increased rapidly” over the past 20 years, the paper finds. It warns that without “urgent” adaptation measures, once-extreme levels of heat-related mortality could become “normal” as global temperatures rise.
“Our findings highlight the urgent need for strong mitigation and adaptation to reduce impacts on human lives,” the authors say.
The lead author warns that the worst impacts of extreme heat are felt by the world’s poorest, who have the lowest ability to adapt to the damaging impacts of high temperatures and have contributed the least to global emissions.
Heat-related mortality
Extreme heatwaves are becoming more frequent, intense and long-lasting as the planet warms. Carbon Brief analysis finds that about half the world’s population saw all-time record temperatures for their location at some point over the past decade.
Extreme heat is deadly. During a heatwave, the number of “heat-related deaths” – where exposure to heat either causes or significantly contributes to a death – tends to increase.
For example, people can suffer from direct consequences of heat, such as heat stroke and exhaustion. Those with underlying health conditions can suffer fatal complications due to the additional stress on their bodies.
More than 61,000 people died as a result of searing heat across Europe in the summer of 2022. And a recent study found that more than one-third of all heat-related deaths recorded over 1991–2018 are linked to climate change.
The new study investigates the link between average daily temperature and “excess mortality” – the number of deaths beyond what would have been expected under “normal” conditions – in 748 small regions, cities and metropolitan areas from 47 countries.
The authors use daily mortality and temperature data from the Multi-Country Multi-City Collaborative Research Network to make “exposure-response” functions for each region, showing the relationship between temperature and excess mortality rate.
“Typically, a population is very well adapted to the climate where it’s living,” explains Sam Lüthi – a PhD student at ETH Zurich and lead author on the study. This means that each city has a different exposure-response curve. Examples are shown below for Sao Paulo in Brazil, Paris in France and Bangkok in Thailand.
The city’s optimum temperature – at which temperature-related mortality is as low as possible – is indicated by a “relative risk” level of one. If the temperature rises above or falls below the optimum temperature, the risk of temperature-related mortality increases. This is indicated by a relative risk level greater than one.
The vertical dotted lines indicate the 99th percentile of temperature – indicating that only the most extreme 1 per cent of temperatures for that location lie to the right of the line.
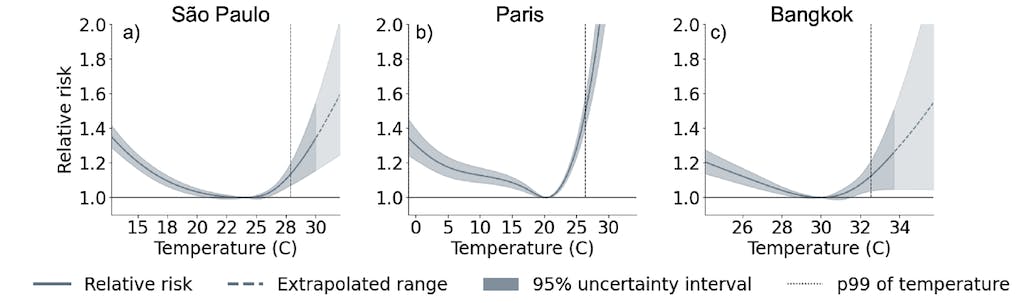
Exposure-response functions for Sao Paulo (left), Paris (middle) and Bangkok (right). The city’s optimum temperature is indicated by a “relative risk” level of one. Source: Lüthi et al (2023)
Countries and cities that implement strong adaptation measures – such as air conditioning and communal cooling centres – can often avoid the most severe consequences of extreme heat, the study says.
Meanwhile, it warns that those that do not adequately prepare, perhaps because they have not recently experienced extreme heat, face the greatest risk from record-breaking temperatures.
Worsening odds
Climate scientists often use the “return period” of an extreme weather event to indicate how likely it was.
For example, the April 2023 heatwave that swept across southern Europe and northern Africa had a return period of 400 years. This means that a heatwave of this magnitude or hotter is expected, on average, once every 400 years in the current climate – giving it a 0.25 per cent chance of happening in any given year.
The authors of the new study apply the same concept to heat-related mortality. In the paper, a 1-in-100 year heat-mortality event is a heatwave with mortality levels that are only seen or exceeded once every 100 years in the same climate. Heat-induced mortality of this magnitude or higher has a 1 per cent chance of happening in any given year.
To assess how heat-induced mortality will change in a warming climate, the authors combine their exposure-response relationships with the outputs from a range of climate models using the natural catastrophe risk platform CLIMADA.
The authors define 1-in-10, 1-in-100 and 1-in-500 year mortality events in the climate of the year 2000, when global warming was around 0.7C above the pre-industrial temperatures. The 1-in-500 year year event is the least likely and most deadly.
They then assess how often events of this magnitude can be expected in worlds with 1.2C (corresponding to a climate in the year 2020), 1.5C warming and 2C warming levels, for each of their 748 regions.
The graphic below is an example for Paris. The four large circles represent 0.7C, 1.2C, 1.5C and 2C worlds respectively. Each circle contains 100 coloured dots, representing 100 years. Yellow dots represent “non-extreme” years, defined using the climate in the year 2000. Orange, purple and black dots indicate, respectively, the 1-in-10, 1-in-100 and 1-in-500 year extremes in the climate of the year 2000.
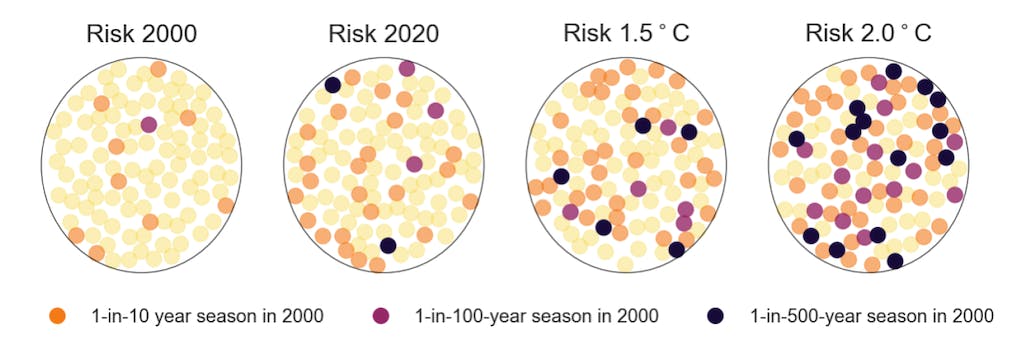
Heat-related mortality in Paris. The four large circles represent 0.7C, 1.2C, 1.5C and 2C worlds respectively. Each circle contains 100 coloured dots, representing 100 years. Yellow dots represent “non-extreme” years, defined using the climate in the year 2000. Orange, purple and black dots indicate the 1-in-10, 1-in-100 and 1-in-500 year extremes in the climate of the year 2000. Source: Lüthi et al (2023).
The study finds that as the planet warms, higher mortality events become more likely. For example, in Paris, a 1-in-100 year heat mortality event has a 1 per cent chance of happening in the year 2000 – indicated by the single pink dot in the leftmost circle.
However, as global temperatures rise, the likelihood of this event rises. This is shown by an increase in the number of purple dots to five in the 2020 climate, 10 in a 1.5C world and 27 in a 2C hotter world. The authors also find that under a 2C warming level, “non-extreme” mortality years will be rarer than “extreme” years in Paris.
The authors also calculate the new return period of a 1-in-100 year event in the climate of 2020, and under warming levels of 1.5C and 2C above pre-industrial temperatures, for each of the 748 regions.
These results are plotted on the maps below. Darker colours proliferate at higher warming levels, indicating that heatwaves are more intense and heat-related deaths are more likely. Note that the scale is logarithmic, rather than linear.
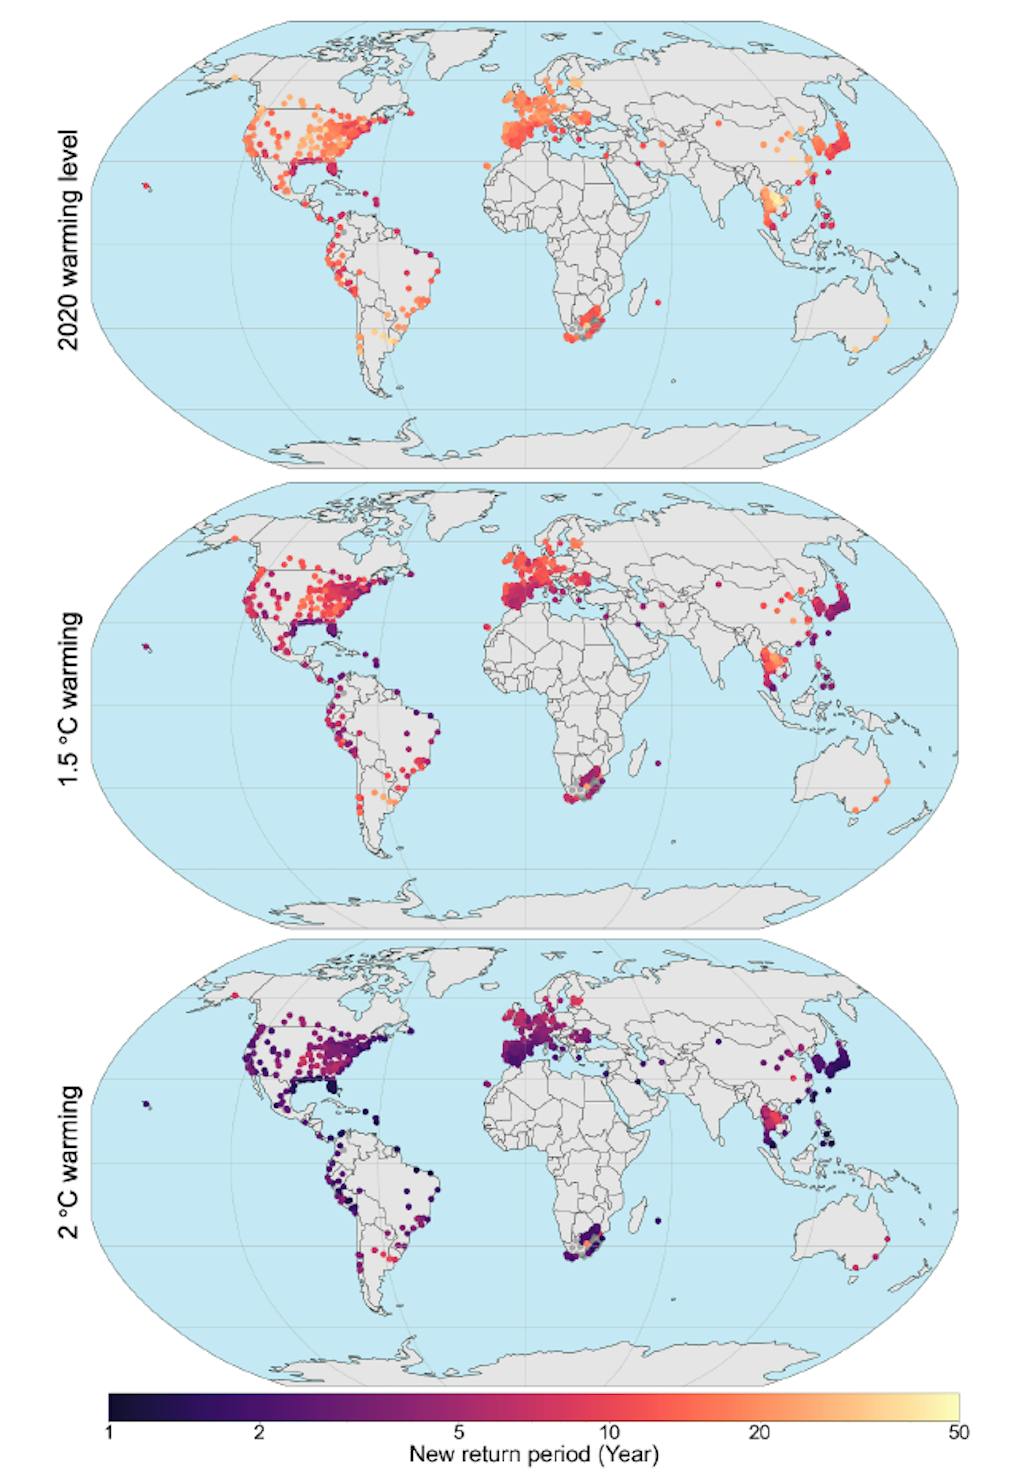
The new return period of a 1-in-100 year event for the year 2000, for a 2020, 1.5C and 2C climate, for each of the 748 regions. Lüthi et al (2023).
“The risk has already shifted strongly,” Lüthi tells Carbon Brief. He says that in many of the regions studied, if no adaptation takes place, what used to be a 1-in-100 year heat mortality extreme in the year 2000 will be expected roughly every other year under a 2C warmer climate.
The results show that “even moderate-sounding rises in global temperature increase the dangers of global heating very dramatically”, adds Prof Peter Stott – a science fellow in climate attribution at the UK Met Office, who was not involved in the study.
However, there are sizable gaps in the dataset used in this study, shown by the grey on the maps. “Despite having access to what is, to our knowledge, the most comprehensive data set for climate change epidemiology, our geographical scope is somewhat limited and overrepresents western regions compared to other parts of the world,” the study says.
“It’s really nice that we have all that data over Europe,” Lüthi tells Carbon Brief. However, he calls the lack of data collection in tropical regions and countries in the global south a “big issue”, warning that he and his team are “blind” in “data-scarce regions” such as the tropics, where extreme heat is likely to be the “roughest”.
A Carbon Brief guest post outlines why heat-related mortalities are under-reported in poorer countries:
“In most developed countries, national governments provide numbers on affected people, mortality and, in some cases, even economic losses for extreme weather events. In contrast, for many low-income countries these reports are provided by different NGOs with little or no connection to meteorological services. Thus, a central place where reports on the nature of the event and its impacts are coming together is lacking…
A further reason is that global databases on extremes – and analysis of their impacts – is largely carried out by research organisations in western nations. This means that there is a bias towards events in these countries.”
Unequal exposure
As average temperatures rise, heat-related mortality is rising. Stott tells Carbon Brief that “the health impacts of climate change could be changing even faster than the weather extremes are changing, due to the highly non-linear relationship between temperatures and mortality”.
Using daily mortality data from the Multi-Country Multi-City Collaborative Research Network as a baseline, the authors calculate heat-related mortality as a percentage of total deaths from all causes during 1-in-100 year events in different climates.
These figures are shown for the climates of 2000 (top left), 2020 (top right), 1.5C warming (bottom left) and 2C warming (bottom right). Blue indicates low rates of heat-induced mortality, while yellow indicates high rates. Note that the scale is logarithmic.
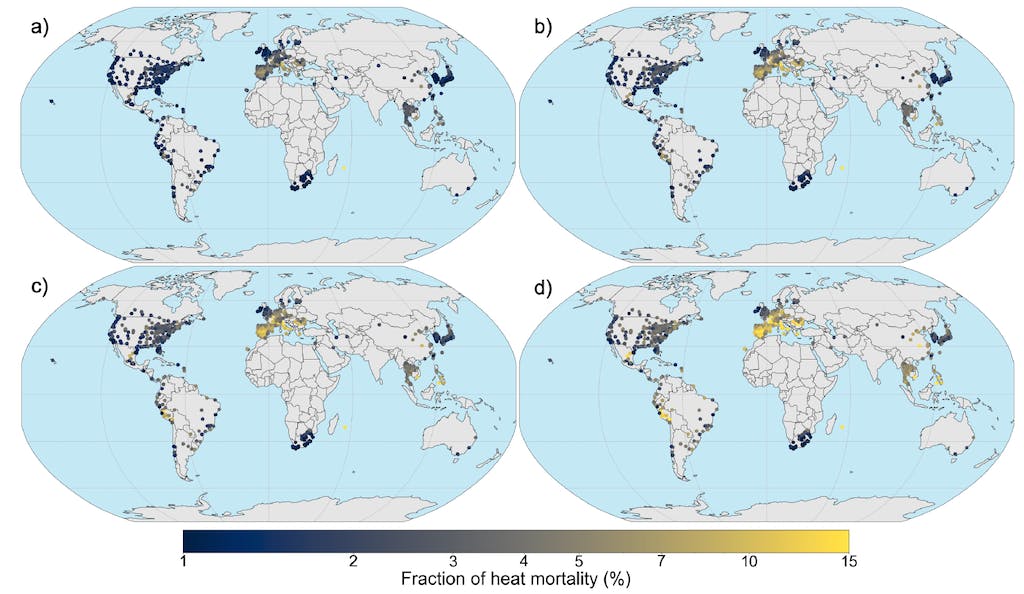
Heat-related mortality as a percentage of total deaths under 1-in-100 year events for the climates of 2000 (top left), 2020 (top right), 1.5C warming (bottom left) and 2C warming (bottom right). Source: Lüthi et al (2023)
The authors find that if warming reaches 1.5C above pre-industrial temperatures, high temperatures could claim as many as 10 per cent of deaths during periods of extreme heat.
The paper also warns that poor regions typically face the greatest risk from extreme heat. “Heat is a very social hazard,” Lüthi explains.
“Our findings highlight the urgent need for strong mitigation and adaptation to reduce impacts on human lives,” the paper says.
The study assumes that countries do not implement any adaptation measures in response to the rising heat. This is unlikely, as countries often adapt in response to extreme temperatures.
For example, the infamous European heatwave of 2003 claimed around 70,000 lives. When Europe was struck again by extreme heat in 2006, mortality rates were far lower thanks to preventive measures set up by health authorities and institutes.
However, the ability of different countries, cities and individuals to adapt to changes – known as their “adaptive capacity” – depends on a range of financial, economic, governance and socio-cultural factors.
Wealthier communities living in developed countries with strong government support are able to adapt to the changing climate more quickly and easily than poorer communities in developing countries.
“A large proportion of mortality from heat extremes can be prevented by better preparedness,” Dr Vikki Thompson – a climate scientist at the Royal Netherlands Meteorological Institute, who was not involved in the research, tells Carbon Brief.
She adds that “relatively simple measures, such as educating people of the risks, can have a huge benefit”.


