
The International Maritime Organization (IMO) rules have had some success in improving public health. Global emissions of sulphur dioxide (SO2) – a health-damaging air pollutant – have dropped by about 10 per cent as a result.
But the shift to low-sulphur shipping fuel has had an additional consequence.
Sulphur particles contained in ships’ exhaust fumes have been counteracting some of the warming coming from greenhouse gases. But lowering the sulphur content of marine fuel has weakened the masking effect, effectively giving a boost to warming.
Some researchers have proposed that the drop in SO2 as a result of the IMO’s clean air regulations could be behind a recent spike in global sea surface temperature.
Carbon Brief analysis shows that the likely side-effect of the 2020 regulations to cut air pollution from shipping is to increase global temperatures by around 0.05C by 2050. This is equivalent to approximately two additional years of emissions.
While this will contribute to warming and make it even more difficult to avoid exceeding 1.5C in the coming decades, a number of other factors are likely contributing to the ocean heatwave.
These include a massive eruption of an underwater volcano in the south Pacific, an unusual absence of Saharan dust and a growing El Niño.
Phasing down
Nearly all SO2 emissions today are a by-product of fossil fuel combustion.
Globally, SO2 emissions increased from around 6 million tonnes (MtSO2) per year in the 1970s to more than 10MtSO2 per year in the 2000s and 2010s.
SO2 emissions from fossil fuels have long contributed to severe health impacts through the formation of particulate matter known as PM2.5.
Studies estimate that the high sulphur content of marine fuel – which is much higher than levels allowable on land – contributes to between 19,000 and 91,000 premature deaths each year in coastal regions.
Scientists have long included a gradual phaseout of SO2 emissions in climate models as the world transitions away from fossil fuels.
Nearly all emissions scenarios assessed in the recent Intergovernmental Panel on Climate Change’s Sixth Assessment Report (AR6) expect SO2 emissions to decline in the future. The decline in SO2 is faster in scenarios where fossil fuels are phased out more rapidly.
In 2020, regulations introduced by the IMO imposed strict limits on the sulphur content of marine fuels. The new rules lowered the maximum percentage of sulphur from 3.5 per cent to 0.5 per cent for all ships operating worldwide.
This followed a more limited restriction in place between 2010 and 2015 that only applied to ships operating around the coasts of North America and the North Sea.
The rapid phaseout of sulphur in marine fuels likely reduced global SO2 emissions by around 8.5MtSO2 per year, to around 2.5 MtSO2 per year. This represents an abrupt decline in global SO2 emissions of around 10 per cent after 2020.
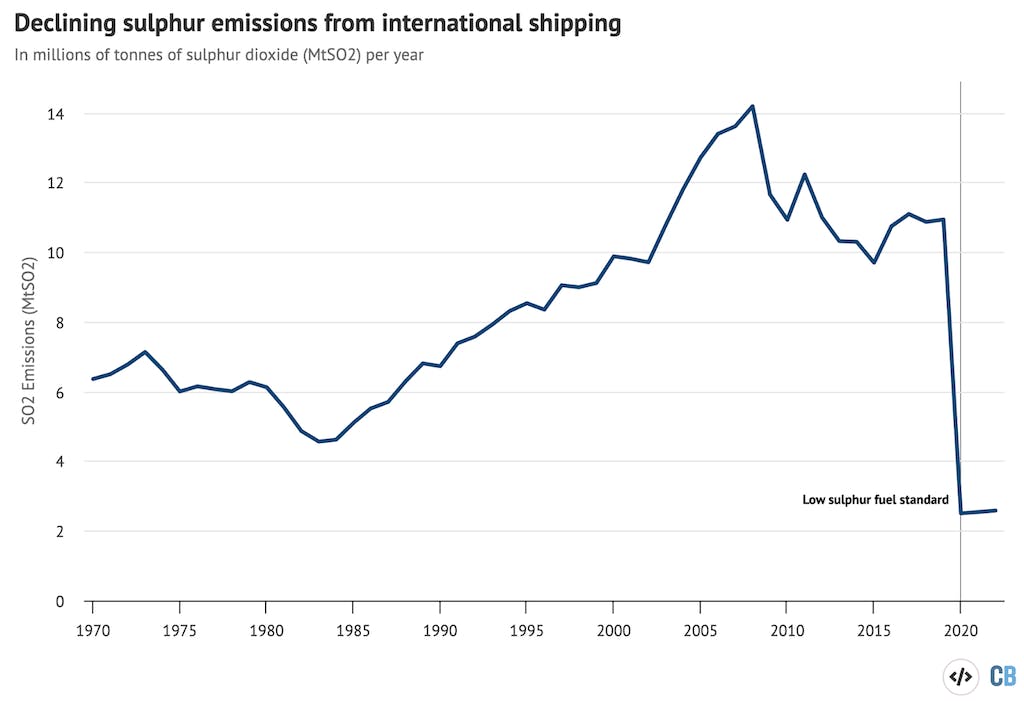
Global SO2 emissions from international shipping from the global aerosol dataset (CEDS) (1970-2019). Estimates thereafter by Leon Simons based on projected effects of low-sulphur fuel regulations introduced in 2020. Chart by Zeke Hausfather for Carbon Brief, using Highcharts.
In this analysis, Carbon Brief estimates post-2020 SO2 emissions based on the projected impact of the low-sulphur fuel regulations, as the global aerosol dataset (CEDS) is only updated to 2019.
It is possible that compliance with the regulations has not been universal and that the adoption of low-sulphur fuel might be slower than this analysis assumes.
That said, studies undertaken after the phaseout show a strong reduction in measurable ship tracks that occur due to the effects of SO2 on cloud formation. The authors attribute this to the more stringent ship emission regulations since 2020.
Potential culprit
SO2 has a strong cooling effect on the climate, both through directly reflecting incoming sunlight and by acting as cloud condensation nuclei. This increases the formation of reflective clouds.
Given the strong cooling impact of SO2, a 10 per cent reduction in emissions of SO2 will result in additional global warming.
In recent weeks, there has been a huge amount of attention surrounding record sea surface temperature (SST) globally, with some suggesting that the phaseout of sulphur in marine fuel could be a major driver of the warming.
The figure below shows global SST from the US National Oceanic and Atmospheric Administration (NOAA) Optimum Interpolation SST (OISST) dataset for each year since 1981. The current year, 2023, is shown by the solid black line.
Current SST is around 0.2C above the prior record for this time of year, set last year in 2022.
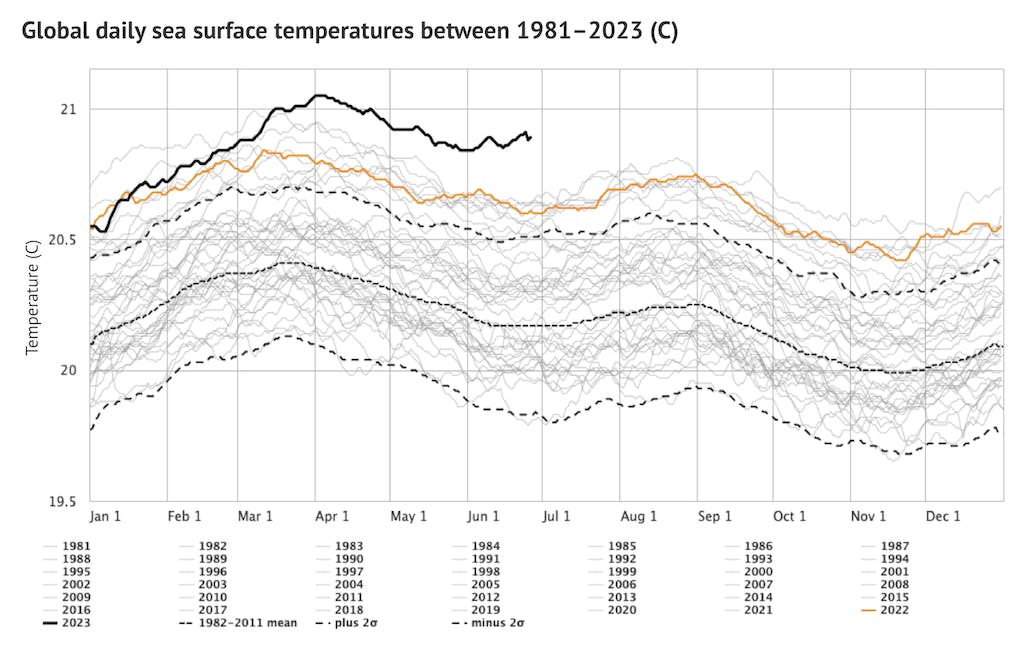
Global daily sea surface temperature (SST) between 60S and 60N from NOAA’s OISST dataset for each year since 1981. The current year is shown in black. Source: Climate Reanalyzer.
Exactly how much additional warming will result from a 10 per cent reduction in SO2 emissions is a challenging question to answer.
This is due to large differences between models in their estimates of both radiative forcing from SO2 (and other aerosols) and how sensitive the climate is to changes in forcing.
Radiative forcing is a measure of the combined effect of greenhouse gases, aerosols and other factors that can influence climate to trap additional heat.
Climate impact
In general, SO2 emissions have a larger climate impact in regions where less is emitted. This is because the effects of sulphur particles on cloud formation saturate after a certain point, such that additional emissions have a smaller effect.
The figure below shows the location of SO2 emissions from marine fuel prior to the IMO regulations in 2020 (left) and the pattern of natural dimethyl sulphide (DMS) emissions, which are primarily emitted by algae (right).
The largest warming impacts are expected where high SO2 emissions from marine fuel overlap with lower DMS emissions. Both areas of high shipping track concentrations (North Atlantic and North Pacific) also have high DMS levels.
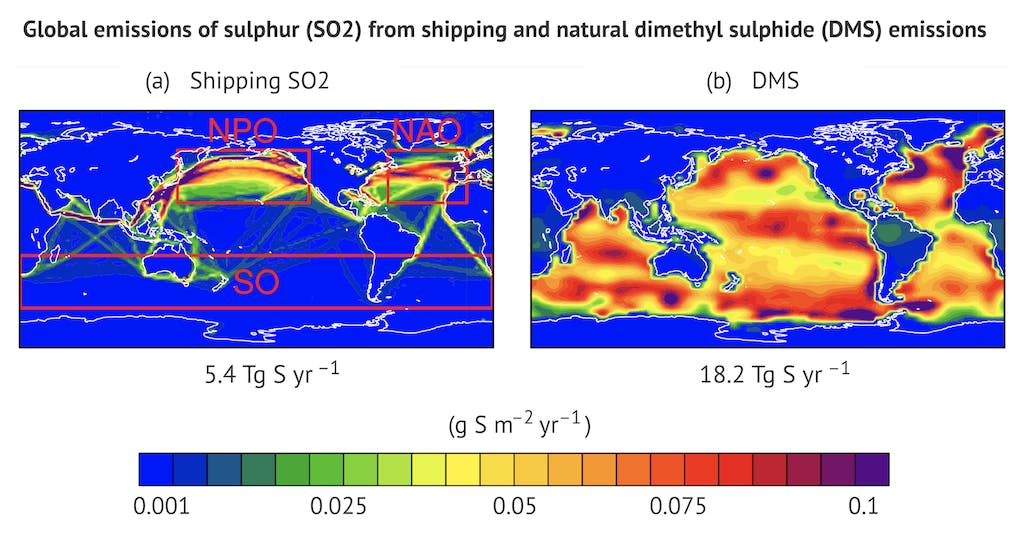
Global emissions of SO2 from shipping prior to IMO regulations limiting sulphur content of marine fuel (left) and the pattern of natural dimethyl sulphide (DMS) emissions (right). Source: Jin et al 2018.
To estimate the likely climate impacts of regulations limiting the sulphur content of marine fuel, Carbon Brief calculates the effect of reducing global SO2 emissions by 8.5MtSO2 per year compared to the same climate scenario without those SO2 emission reductions.
The figure below shows historical SO2 emissions up to 2015 and projected SO2 emissions up to 2050 in SSP2-4.5, a middle-of-the-road scenario that is broadly consistent with the emissions pathway the world is following under policies in place today (light grey).
The same scenario with reduced SO2 emissions is shown alongside (yellow). Black squares represent two observational data points for SO2 emissions in 2019 and 2022 from Forster et al (2023).
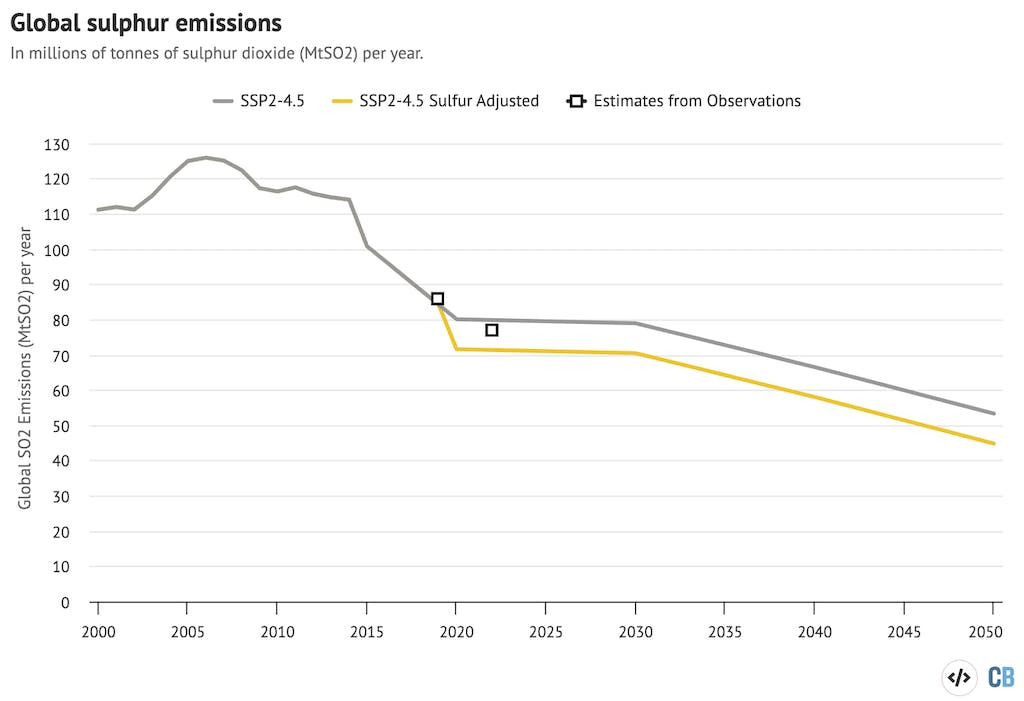
Global SO2 emissions from a middle-of-the-road SSP2-4.5 scenario (grey) and the same scenario with a reduction in SO2 emissions of 8.5MtSO2 per year after 2020 (yellow). Black squares represent observational estimates of SO2 emissions in 2019 and 2022 from Forster et al 2023. Chart by Zeke Hausfather for Carbon Brief, using Highcharts.
It is worth noting that the observational estimates of SO2 represented by the black squares above do not explicitly model the effects of the IMO regulations, but include some observations that may overlap with the regulation effects. This may be reflected in the difference between the 2022 observational estimate and the sulphur-adjusted SSP2-4.5 scenario above.
There is also a risk of double counting SO2 reductions over longer time horizons. Some reduction in SO2 from shipping might be expected to occur even in the absence of the 2020 regulations as the shipping industry – and the world more broadly – decarbonises.
In this case, the two scenarios on the figure above would converge towards the upper (grey) scenario over time.
Forcing a change
Using a simple climate model – the Finite Amplitude Impulse Response (FaIR) model – this analysis compares the change in radiative forcing between the two versions of the SSP2-4.5 scenario, with and without a reduction in SO2 emissions of 8.5MtSO2 per year after 2020.
The results of the comparison suggest that the reduction in SO2 emissions as a result of the 2020 regulations requiring low-sulphur marine fuel increases radiative forcing by 0.079 watts per square metre across Earth’s surface.
This estimate is reasonably well in-line with – though on the lower end of – a number of other published studies that have assessed the likely climate impact of marine low-sulphur fuel.
The figure below shows Carbon Brief’s estimate on the left hand side compared with eight different studies published over the past two decades.
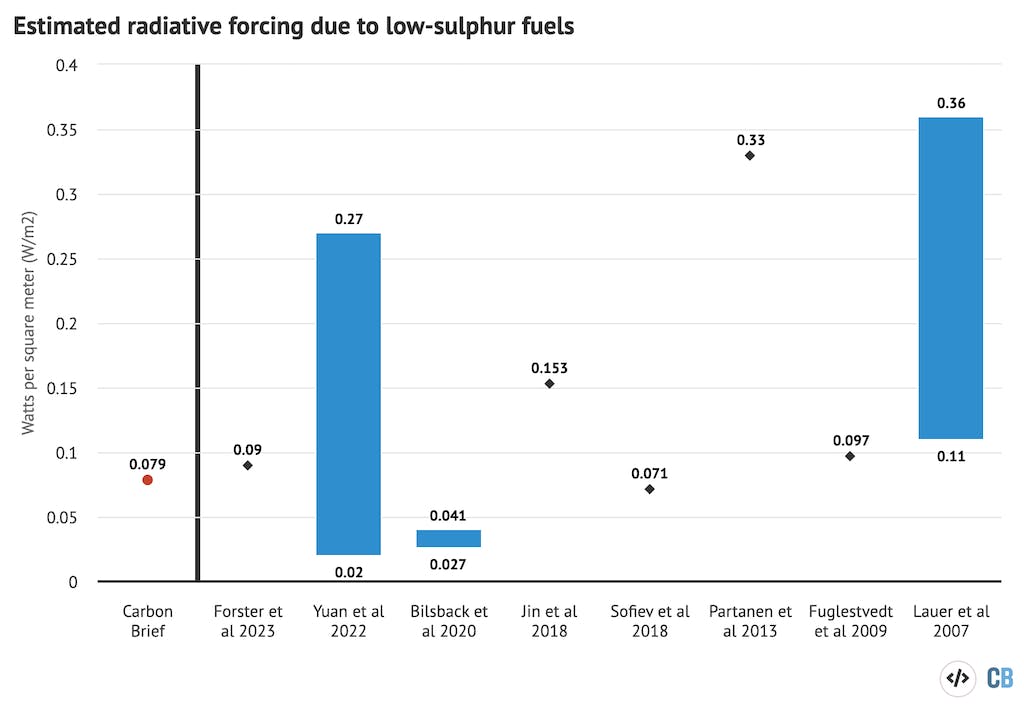
Estimates of global average radiative forcing due to the shift to low-sulphur marine fuel from Carbon Brief, Yuan et al 2022, Bilsback et al 2020, Jin et al 2018, Sofiev et al 2018, Partanen et al 2013, Fuglestvedt et al 2009, and Lauer et al 2007. Forster et al 2023 considers a generic reduction of 9MtSO2 per year and is not specific to marine low-sulphur fuel. Chart by Zeke Hausfather for Carbon Brief, using Highcharts.
It is possible that the increase in forcing over the oceans might be larger than predicted by FaIR, as those regions have lower aerosol concentrations and, thus, larger sulphur effects on cloud formation per unit of emissions. However, as mentioned earlier, oceans have larger background levels of sulphur from natural dimethyl sulphide emissions than land regions.
Warming boost
The next step in working out the climate impact of low-sulphur regulations for marine fuel is to translate the change in radiative forcing into warming.
This analysis uses a version of FaIR designed to emulate an ensemble of 66 of the latest generation models from the Coupled Model Intercomparison Project (CMIP6).
The figure below shows the resulting warming, including the mean (blue line) and 5th/95th percentile (blue shading). The central estimate is around 0.045C warming after 30 years.
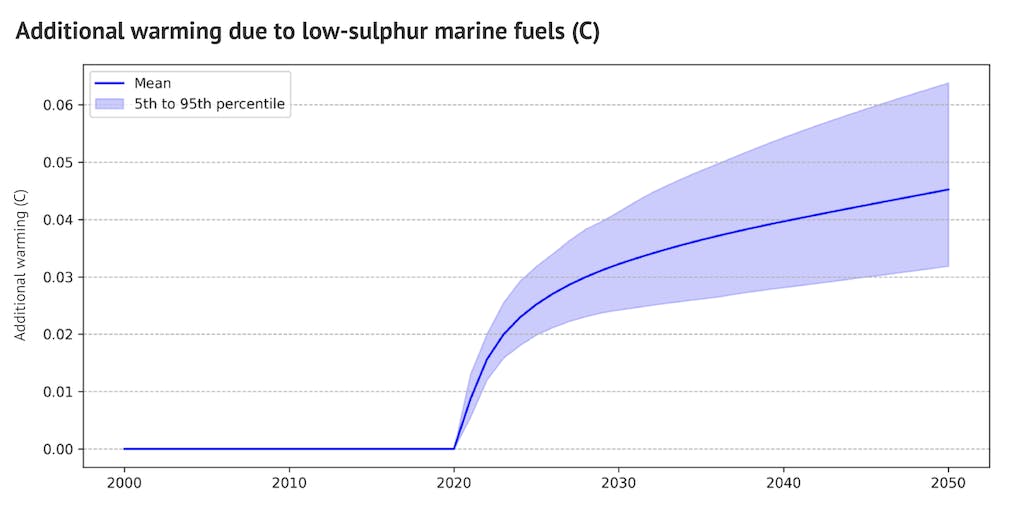
Global mean temperature change from the FaIR model simulating the effects of a reduction in SO2 emissions equivalent to 8.5MtSO2 per year after 2020, relative to the SSP2-4.5 scenario across 66 different CMIP6 models. The solid line shows the average of all model runs, while the shaded area shows the 5th to 95th percentile range. Chart by Zeke Hausfather for Carbon Brief.
An analysis in 2009 estimated that a 90 per cent decline in marine SO2 emissions would result in around 0.05C of additional warming, with a rapid climate response in the first 15 years. This is similar to Carbon Brief’s central estimate of around 0.045C warming after 30 years.
The effects of lower SO2 emissions on the climate are not instantaneous, as it takes some time for the Earth system to respond to a change in forcing. About half of the response to a change in forcing is experienced in the first four years, while the remainder occurs more slowly.
In the case of SO2 emissions over the ocean, the response may be even slower than simulated in the FaIR model due to faster equilibration of temperatures over land than over the ocean.
The figure below shows Carbon Brief’s estimate of overall warming by 2050 with the IMO restrictions on sulphur content in marine fuel (blue) compared to with no regulations (orange).
The SSP2-4.5 scenario is comparable to what is expected under policies in place today and assumes only a modest reduction in future SO2 emissions (compared to deep mitigation scenarios which assume much deeper reductions).
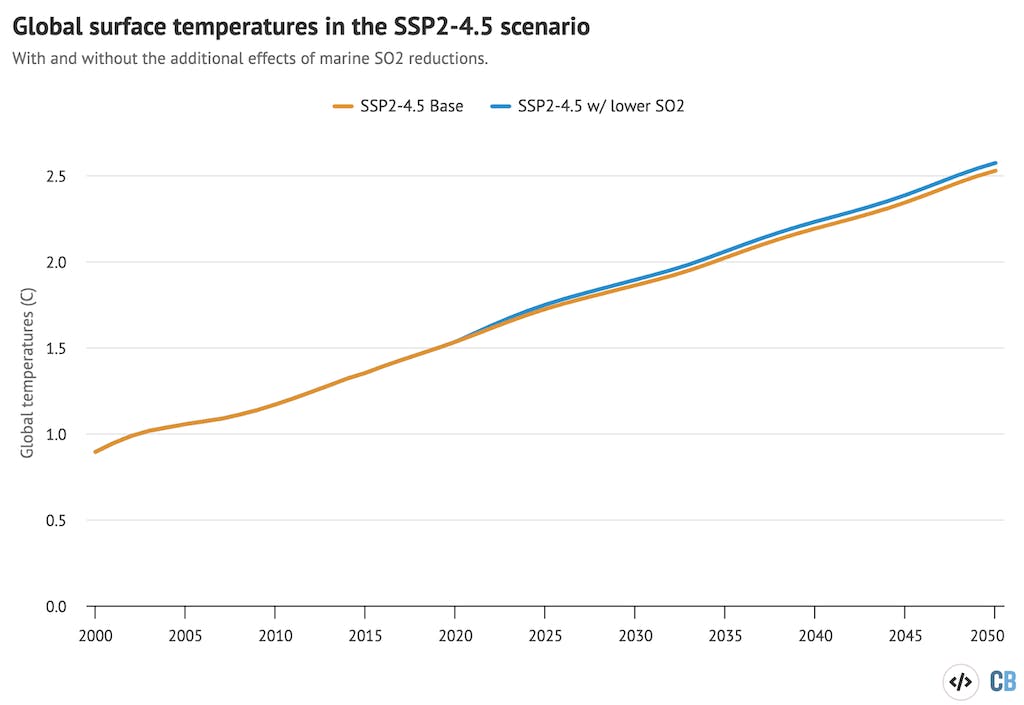
Global mean temperature change from the FaIR model for SSP2-4.5, both with the 8.5 MtSO2 reduction implied by 2020 IMO regulations (blue) and without (orange). Chart by Zeke Hausfather for Carbon Brief, using Highcharts.
Carbon Brief’s analysis suggests that the additional warming due to the IMO regulations on marine fuel is approximately equivalent to two additional years of global greenhouse gas emissions from human activity at their current rate. While this does not fundamentally change where the world is headed in terms of warming by 2050, it does make it more difficult to limit warming to 1.5C over the next few decades.
However, the change in radiative forcing due to a drop in SO2 emissions remains highly uncertain, especially over the oceans. The figure below shows the projected warming in 2030 and 2050 for a variety of forcing estimates found in the literature.
Taking the high end of the range of estimates of radiative forcing could result in up to 0.18C additional warming by 2030 and 0.25C additional warming by 2050, though most studies have found lower forcing estimates than this.
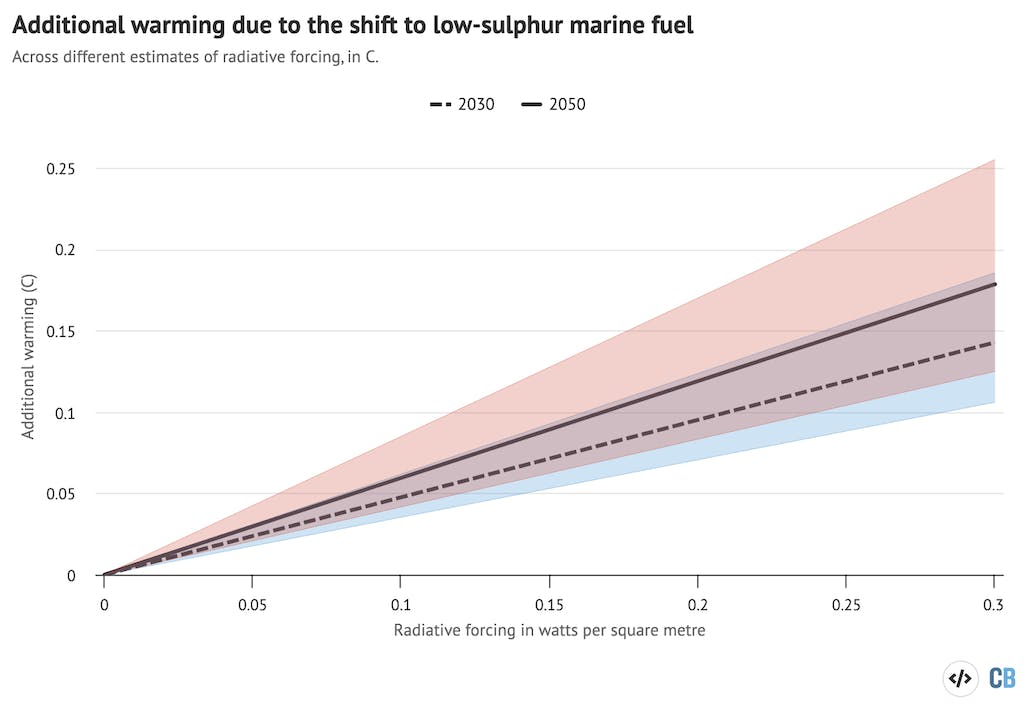
Global mean temperature change from the FaIR model simulating the effects ten years and thirty years after a change in forcing of between 0 and 0.3 watts per square metre in 2020, relative to the SSP2-4.5 scenario across 66 different CMIP6 models. The solid lines show the average of all model runs, while the shaded areas show the 5th to 95th percentile range. Chart by Zeke Hausfather for Carbon Brief, using Highcharts.
Contributing factor
Given that there will be a lagged response from the climate to the shift to low-sulphur marine fuel, it is reasonable to expect less than half of the warming resulting from the 2020 regulations to have materialised by 2023, likely only in the hundredths of a degree globally.
This is unlikely to be sufficient to explain the spike in global sea surface temperature in recent weeks, which is around 0.2C above the prior record for this time of year.
Rather, there are a number of other factors likely contributing to current record-warm ocean temperatures. These include the end of a moderate La Niña event at the start of the year and a developing El Niño, a shift which tends to result in higher global temperatures.
Stratospheric water vapour from the 2022 eruption of the Hunga Tonga-Hunga Ha’apai volcano and an unusual absence of dust from the Sahara Desert over the tropical North Atlantic may also be helping drive the ocean heatwave.
In summary, the primary driver of climate change remains CO2 emissions from fossil fuels. The shift to low-sulphur marine fuel triggered by clean air regulations may increase the warming we experience in the near future, but it will not change our long-term trajectory of around 2.6C of warming by the end of the century.
This story was published with permission from Carbon Brief.


