
In the “likelihood” language of the Intergovernmental Panel on Climate Change (IPCC), this means a new record year is “virtually certain”.
After a cooler start to the year, the past four months have seen truly exceptional global temperatures, surpassing prior monthly records by large margins.
Temperatures during the first few months of 2023 were suppressed by an unusually persistent triple-dip La Niña event, which resulted in lower global temperatures between late 2020 and the start of this year.
Then, starting in March, conditions in the tropical Pacific began to transition rapidly into what is shaping up to be a strong El Niño event. This will likely be weaker than the super El Niño events of 1997-98 and 2015-16, which helped drive record-warm years at the time.
However, global temperatures tend to respond around three months after peak El Niño conditions. The extreme temperatures the world has experienced over the past few months have occurred well before the current El Niño event is expected to peak.
This has led to lots of scientific speculation – though few firm conclusions yet – around the variety of factors that could be contributing to extreme global temperatures along with El Niño and the long-term accumulation of human-caused greenhouse gases.
Hottest year across all records
Based on the temperatures recorded over the first nine months of the year, current El Niño conditions and projected El Niño conditions over the remainder of the year, Carbon Brief can provide an estimate of where each different surface temperature record will likely end up. (See the methodological note at the end for details.)
The figure below shows both the prior record warmest year in each record (coloured square), as well as Carbon Brief’s central estimate of where 2023 will end up (coloured circle) and the 95th percentile confidence interval of that estimate.
(Note that a 2023 projection is not shown for the Hadley/UEA HadCRUT5 dataset given that September data is not yet available.)
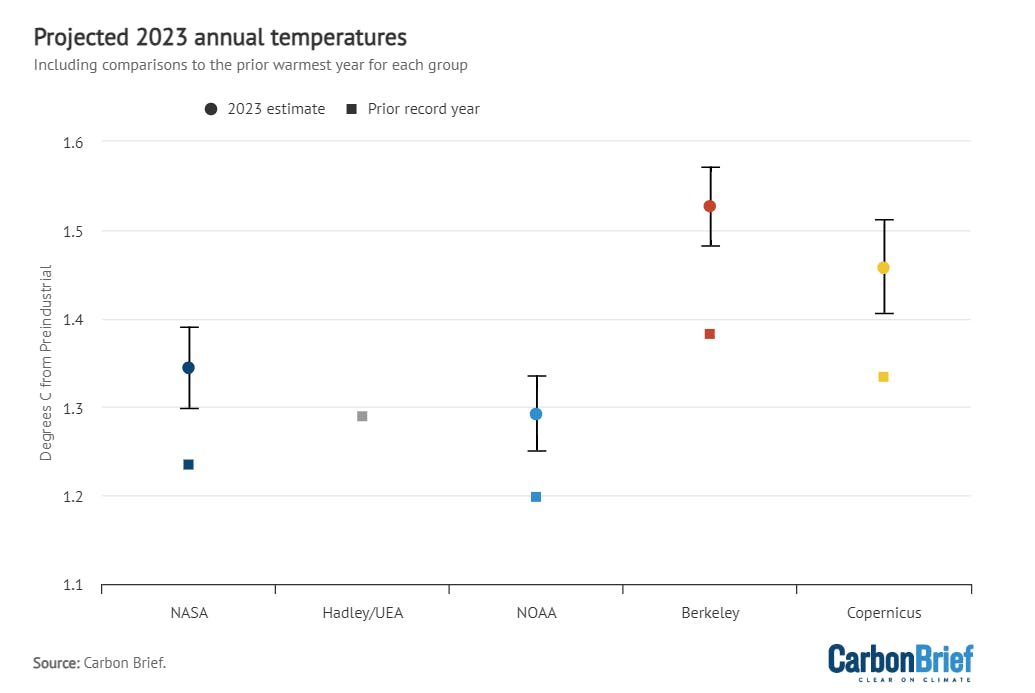
Carbon Brief’s central estimate (dot) and 95th percentile range (whiskers) of where 2023 annual temperatures will end up relative to the pre-industrial period for each group. Note that Hadley/UEA is not shown as data was not available through September at time of publication. The Copernicus values shown here use HadCRUT5 data to estimate warming between 1850-99 and 1981-2010. See the methodological note at the end for details. Chart by Carbon Brief.
The figure below shows these estimates in context with their respective records going back to 1970.
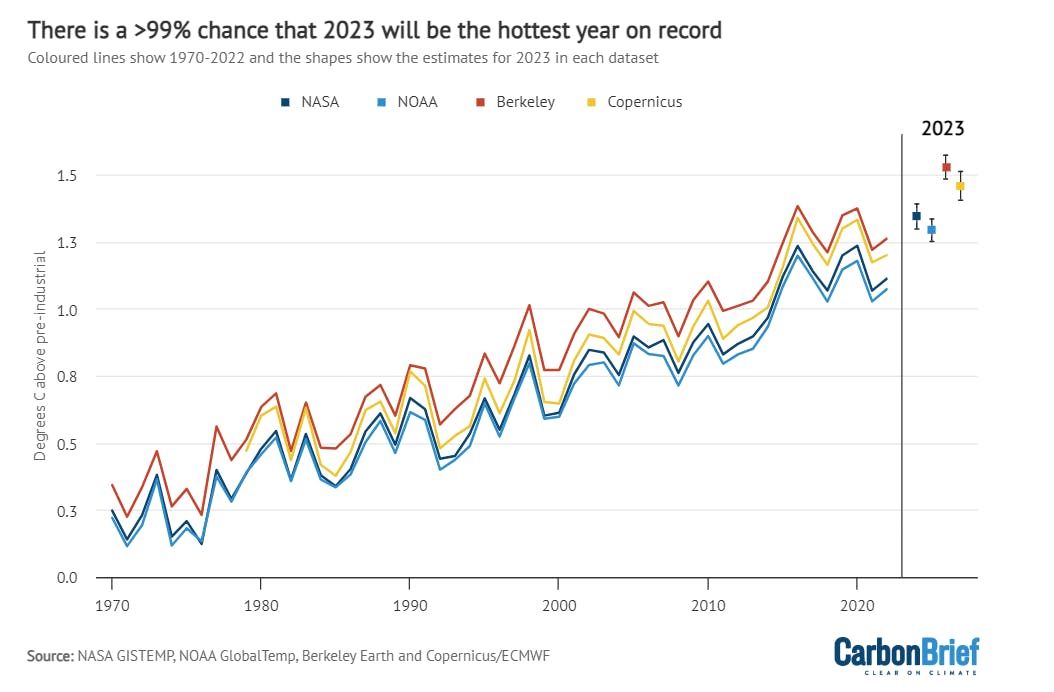
Annual global average surface temperatures from NASA GISTEMP, NOAA GlobalTemp, Berkeley Earth and Copernicus/ECMWF (lines), along with 2023 estimates (as previous chart). Chart by Carbon Brief.
Based on Carbon Brief’s analysis, there is a greater than 99 per cent chance that 2023 will be the warmest year on record across the NASA GISTEMP, NOAA GlobalTemp, Berkeley Earth and Copernicus/ECMWF datasets.
This is up substantially from the 47 per cent-to-79 per cent likelihood that Carbon Brief estimated at the end of July, reflecting just how high global temperatures have been over the past three months.
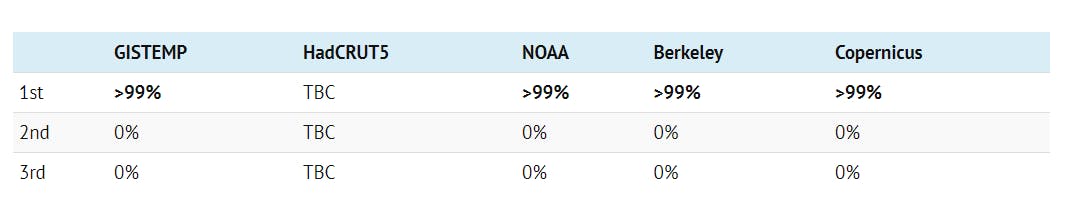
Estimated probabilities of where 2023 will rank compared to previous years for each global temperature dataset. Note that these probabilities do not include measurement uncertainty for each record. Hadley/UEA is not shown as data was not available through September at time of publication. See the methodological note at the end for details.
While all the different temperature datasets project that 2023 will exceed the prior 2016 record by a similar margin, the expected warming in 2023 relative to pre-industrial conditions varies widely across the datasets. The central estimates range from 1.29C (NOAA) and 1.35C (NASA) above pre-industrial (1850-99) levels, to 1.46C (Copernicus) and 1.53C (Berkeley Earth).
(It is important to note that hitting 1.5C in an individual year is not equivalent to a breach of the 1.5C warming limit in the Paris Agreement. The latter refers specifically to long-term human-caused warming and not annual temperatures that include the influence of natural fluctuations in the climate, such as El Niño.)
These differences primarily emerge from variations in how different temperature datasets reconstruct global temperatures in the period prior to 1920 – where global temperature data is more sparse – and which data is used. How gaps between observations are filled has a notable effect on the resulting temperatures. Differences in the ocean dataset used also contribute to variations across groups in estimated warming since pre-industrial times.
The figure below shows Carbon Brief’s estimated 2023 annual temperatures in the Berkeley Earth dataset (red square), as well as the 2023 value to-date (e.g. the average of the first nine months of the year, shown as a yellow diamond).
In this case the annual estimate is slightly higher than the value to-date due to the expectation of continued high global temperatures over the coming three months as El Niño conditions intensify.
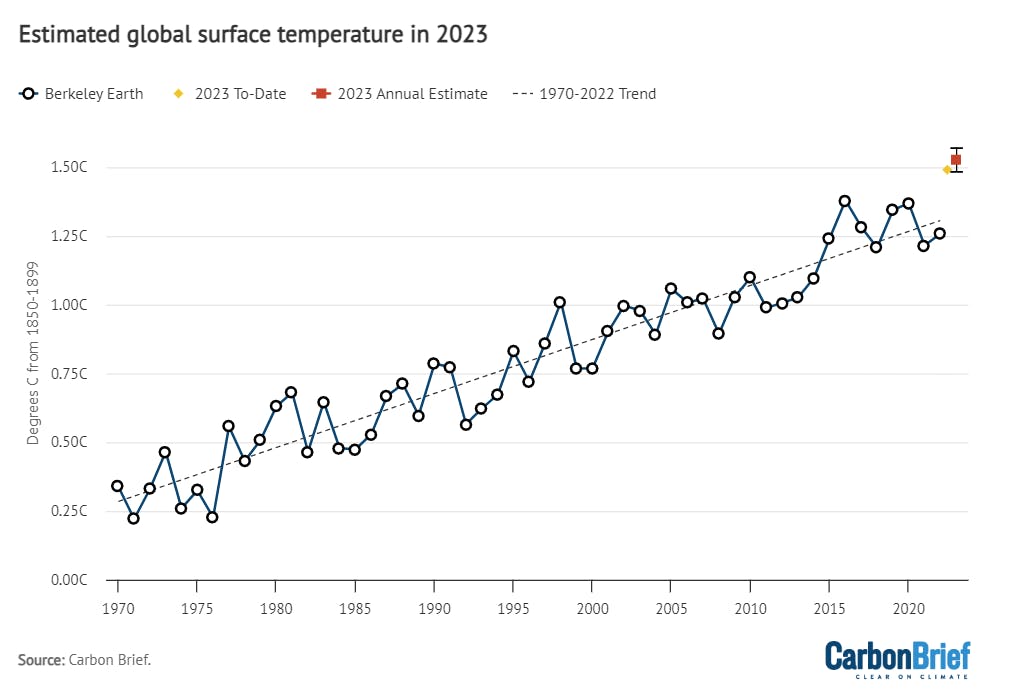
Annual temperatures from Berkeley Earth from 1970-2022, along with year-to-date values (yellow diamond) and Carbon Brief’s 2023 projection for the dataset (red square and black whiskers). Chart by Carbon Brief.
New record becomes clear
This latest estimate is notably higher than most scientists expected early in the year. Because the year started out cooler compared to the prior few years, estimates of annual 2023 temperatures early in the year suggested that 2023 would only be one of the top four warmest years on record.
As the figure below shows, this projection started to change with warmer March, April and May temperatures. But it is only in the past two months that it has become unambiguously clear that 2023 will be the warmest year on record.
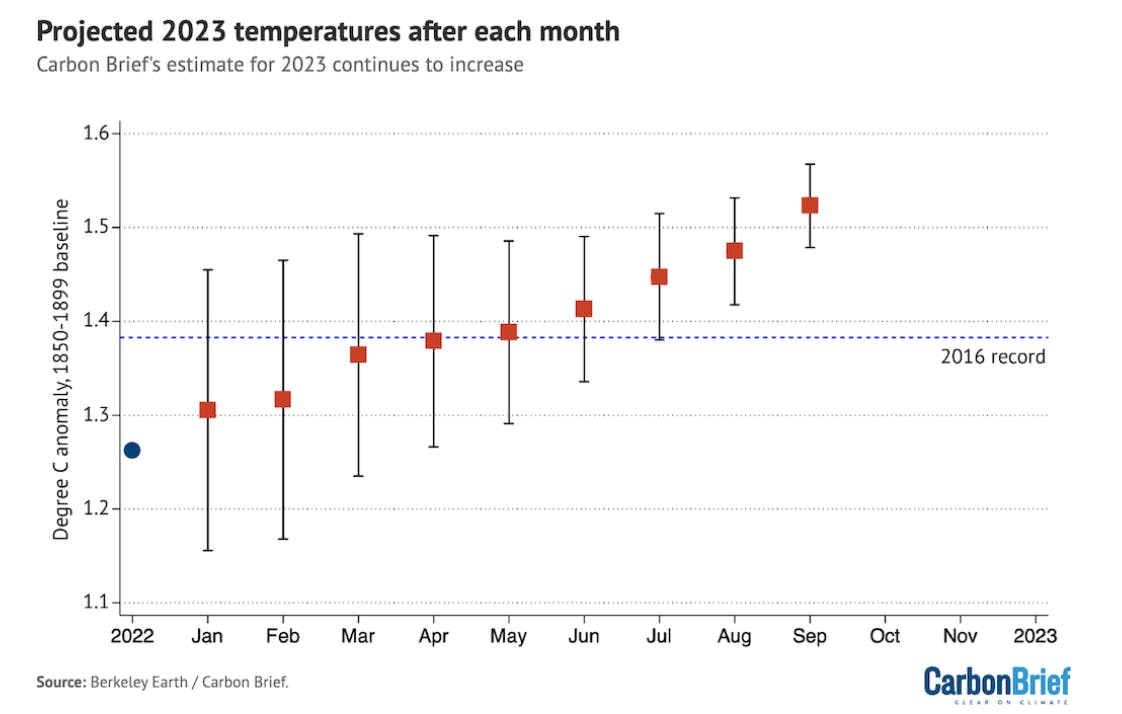
Carbon Brief’s estimate of where 2023 annual temperatures would end up in the Berkeley Earth dataset after data for each month of the year first became available. Chart by Carbon Brief.
Similarly, as Carbon Brief reported back in January, most groups (including Carbon Brief) projected that 2023 would end up similar to or slightly warmer than 2022 at the start of the year.
The figure below shows 2023 projections made before any data was available for the year by NASA’s Dr Gavin Schmidt (purple square), the UK Met Office (dark blue), Berkeley Earth (blue) and Carbon Brief (yellow), compared to the latest estimate using data through September (red).
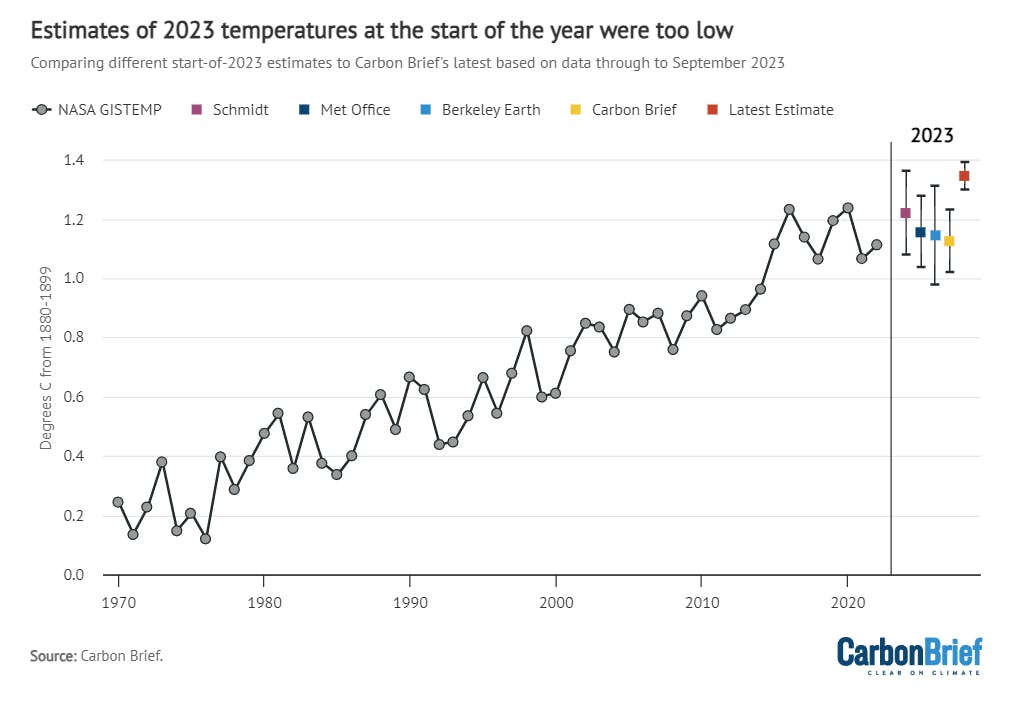
Annual temperatures from NASA GISTEMP from 1970-2022, along with 2023 estimates published at the start of the year prior to any 2023 data being available (coloured dots and whiskers), as well as the latest estimate using data through September (red dot and whiskers). Chart by Carbon Brief.
No one predicted just how extreme 2023 temperatures would be back at the start of the year (though Dr Schmidt was the closest).
The extreme summer temperatures that have driven such a change in fortunes for 2023 has drawn the attention of many scientists. On top of the long-term warming trend caused by human-caused greenhouse gas emissions, there are several other factors at play. In addition to the strong El Niño event, there are likely to be warming contributions from a reduced cooling influence from air pollution, a natural peak in the sun’s intensity and the water vapour injected into the stratosphere by the Hunga Tonga–Hunga Ha’apai volcanic eruption in January last year.
The climate science community is working hard to better understand these different drivers – and what they entail for global warming going forward.
Methodological note
A statistical multivariate regression model was used to estimate the range of likely 2023 annual temperatures for each group that provides a temperature record. This model used the average temperature over the first nine months of the year, the average ENSO 3.4 region value during the first nine months of the year and the average predicted ENSO 3.4 value during the last three months of the year to estimate the annual temperatures.
The model was trained on the relationship between these variables and annual temperatures over the period from 1970-2022 (or 1979-2022 for the Copernicus/ECMWF dataset). The model then uses this fit to predict both the most likely 2023 annual value for each group, as well as the 95 per cent confidence interval. The predicted ENSO 3.4 region values for the last three months of 2023 are taken from the IRI plume forecast.
The percent likelihood of different year ranks for 2023 is estimated by using the output of the regression model, assuming a normal distribution of results. This allows Carbon Brief to estimate what percent of possible 2023 annual values fall above and below the temperatures of prior years for each group.


