
The past four months, in particular, have far exceeded any prior records, with September smashing the prior record by around 0.5°C.
In this latest “state of the climate” quarterly update, Carbon Brief finds:
- June, July, August, September and (very likely) October were the warmest respective months since records began.
- 2023 is now virtually certain to be the hottest year on record globally.
- A strong El Niño is expected to persist until mid-2024 in the majority of El Niño Southern Oscillation (ENSO) forecast models.
- October is likely to be extremely warm based on daily data so far, though not quite as unusual as September.
- While the exceptional warmth of the last few months is primarily driven by a strong El Niño on top of human-driven warming, other contributing factors include an uptick in the 11-year solar cycle, an unusual volcanic eruption last year and a 2020 phaseout of planet-cooling sulphur dioxide in marine shipping fuels.
- Ocean heat content set a new record in September and has increased substantially over the past 12 months.
- Antarctic sea ice has been exceptionally far below the prior record low for the past six months, while Arctic sea ice remains at the low end of the historical range.
- Global temperatures are closely aligned with the projections from climate models.
Global temperatures have soared in recent months
After a cool start due to an unusually persistent “triple dip” La Niña event, global temperatures have soared in recent months driven by rapidly growing El Niño conditions.
This short-term natural variability builds on top of the roughly 1.3C warming that has occurred since the mid-1800s due to human emissions of CO2 and other greenhouse gases.
The figure below shows how global temperature so far in 2023 (black line) compares to each month in different years over the prior decade (coloured lines) in the Berkeley Earth surface temperature dataset.
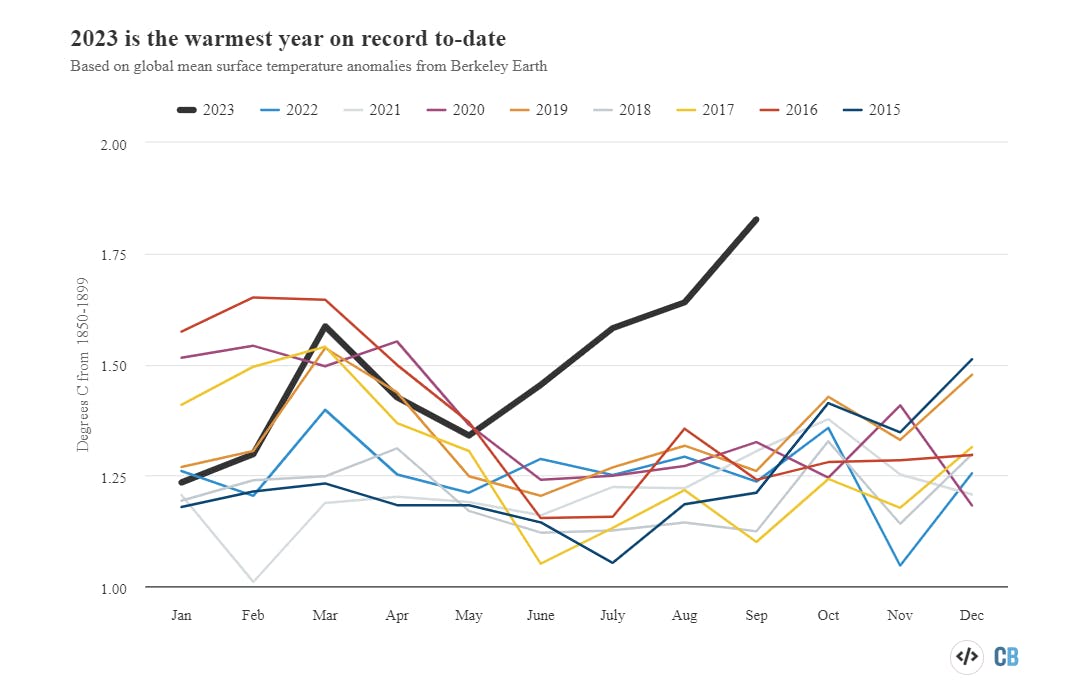
Temperatures for each month from 2015 to 2023 from Berkeley Earth. Anomalies plotted with respect to a 1850-99 baseline. Chart by Carbon Brief.
Every month from June onward this year has set a clear record, with July, August and September shattering prior records by at least 0.3C (and around 0.5C in the case of September). The exceptional summer warmth means that it is now virtually certain that 2023 will be the warmest year on record.
In this latest quarterly state of the climate assessment, Carbon Brief analysed records from five different research groups that report global surface temperature records: NASA’s GISTEMP; NOAA’s GlobalTemp; Hadley/UEA’s HadCRUT5; Berkeley Earth; and Copernicus/ECMWF.
The figure below shows the annual temperatures from each of these groups since 1970, along with the average over the first nine months of 2023. (Note: at the time of writing, September data was not yet available for the Hadley/UEA record.)
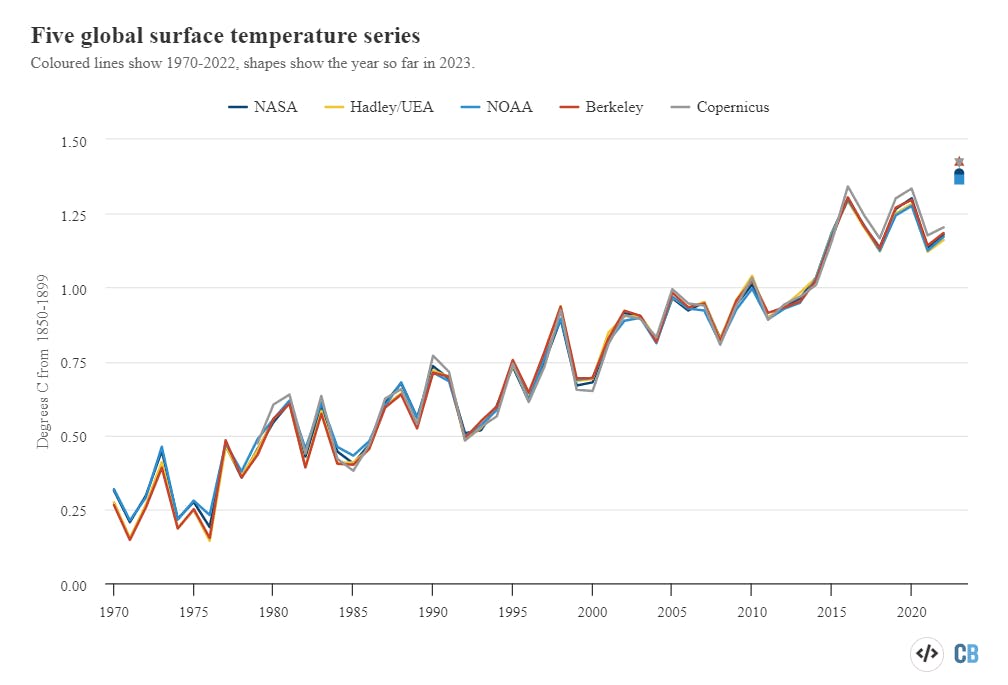
Annual global mean surface temperatures from NASA GISTEMP, NOAA GlobalTemp, Hadley/UEA HadCRUT5, Berkeley Earth and Copernicus/ECMWF (lines), along with 2023 temperatures to date (January-September, coloured shapes). Each series is aligned by using a 1981-2010 baseline, with warming since pre-industrial based on HadCRUT5 values from the 1850-1899 to 1981-2010 periods. Chart by Carbon Brief.
The globe as a whole has warmed around 1C since 1970, with strong agreement between different global temperature records. All show that year-to-date 2023 records are higher than any prior annual record. However, there are larger differences between temperature records further back in time (particularly pre-1900) due to sparser observations and a resulting greater sensitivity to how gaps between measurements are filled in.
This year started out a bit on the colder side in all the different temperature records, with January only the seventh warmest January on record and February only the fourth or fifth warmest. March was the second warmest on record, April the fourth or fifth, and May the third warmest across all datasets.
However, from June onward each month has been unambiguously the warmest on record across all the different datasets. The respective rankings of each month in each dataset are shown below.
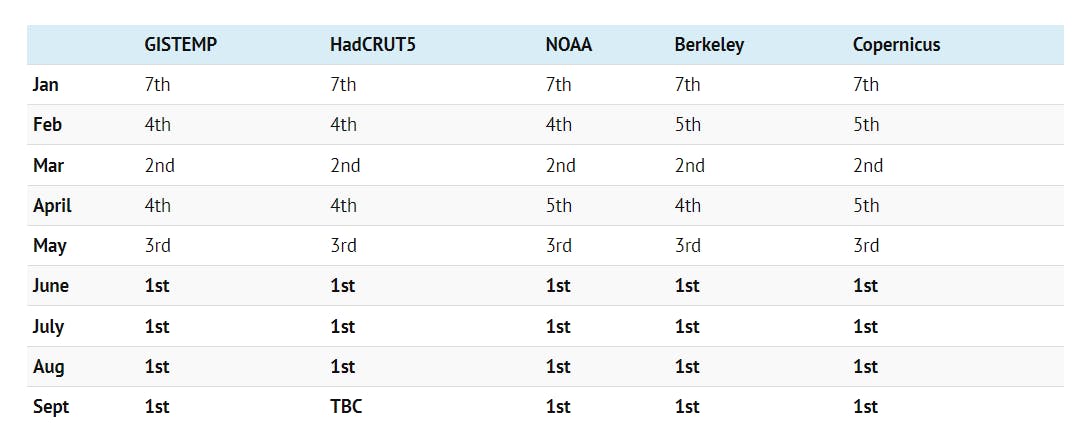
Rankings of 2023 global temperature by month across different datasets.
The continued strengthening of El Niño over the next few months means that it is likely that this streak of record-setting warmth will continue.
The figure below shows a range of different ENSO forecast models produced by different scientific groups. The values shown are sea surface temperature variations in the tropical Pacific – the El Niño 3.4 region – for three-month periods.
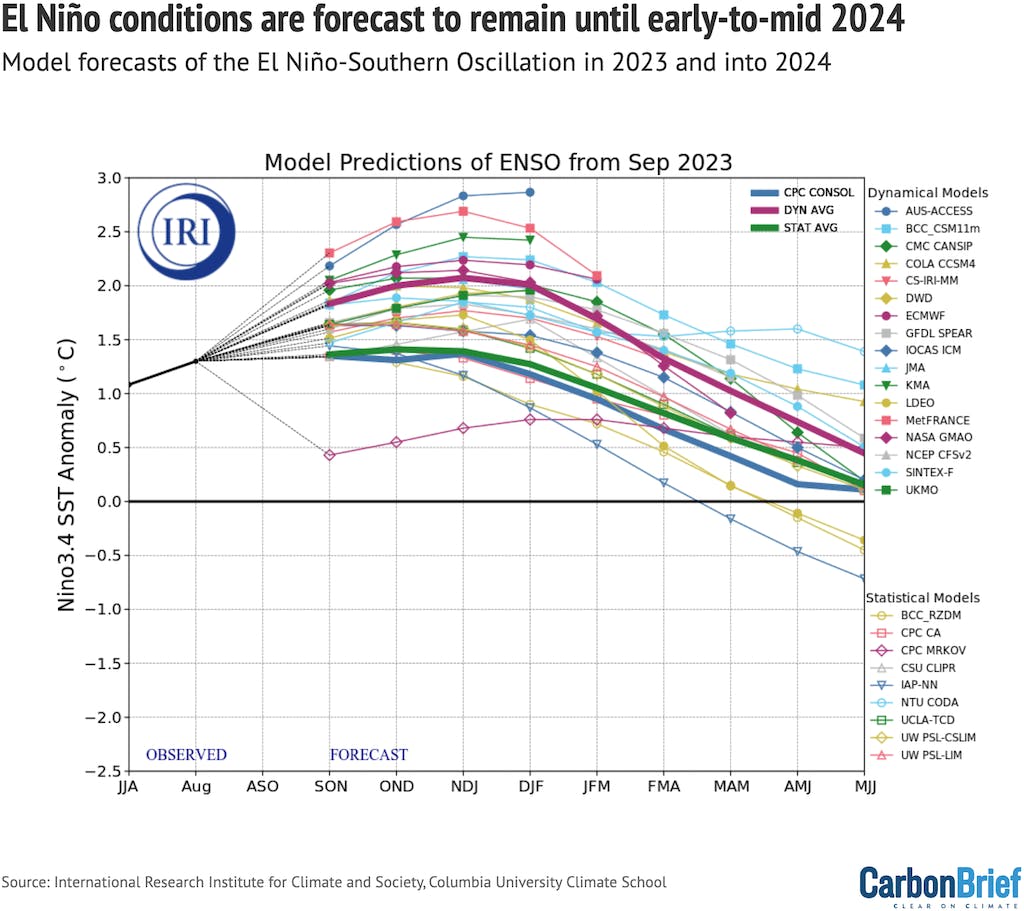
El Niño-Southern Oscillation (ENSO) forecast models for overlapping three-month periods in the Niño3.4 region (August, September, October - ASO - and so on) for the remainder of 2023 and then into the summer of 2024. Credit: Images provided by the International Research Institute for Climate and Society, Columbia University Climate School.
Virtually all models expect El Niño conditions to remain until early-to-mid 2024. Most models project a strong El Niño (>1.5C Niño 3.4 sea surface temperature – SST – anomaly), but relatively few expect a “super El Niño” (>2.5C) as strong as the world saw in 2015-16 or 1997-98.
Extreme heat worldwide
Record-setting global temperatures contributed to record heatwaves in many regions over the recent northern-hemisphere summer. The figure below shows the parts of the world that saw record warm or cold temperatures over the first two-thirds of 2023 (January through to September) in the Berkeley Earth dataset.
Large parts of the North Atlantic saw record warm temperatures, as did the UK, large parts of Europe, the southern US and Mexico, Central America, South America, the Caribbean, Korea, Japan and China.
Notably, no area on Earth saw record cold (or even the second-to-fifth coldest temperatures on record).
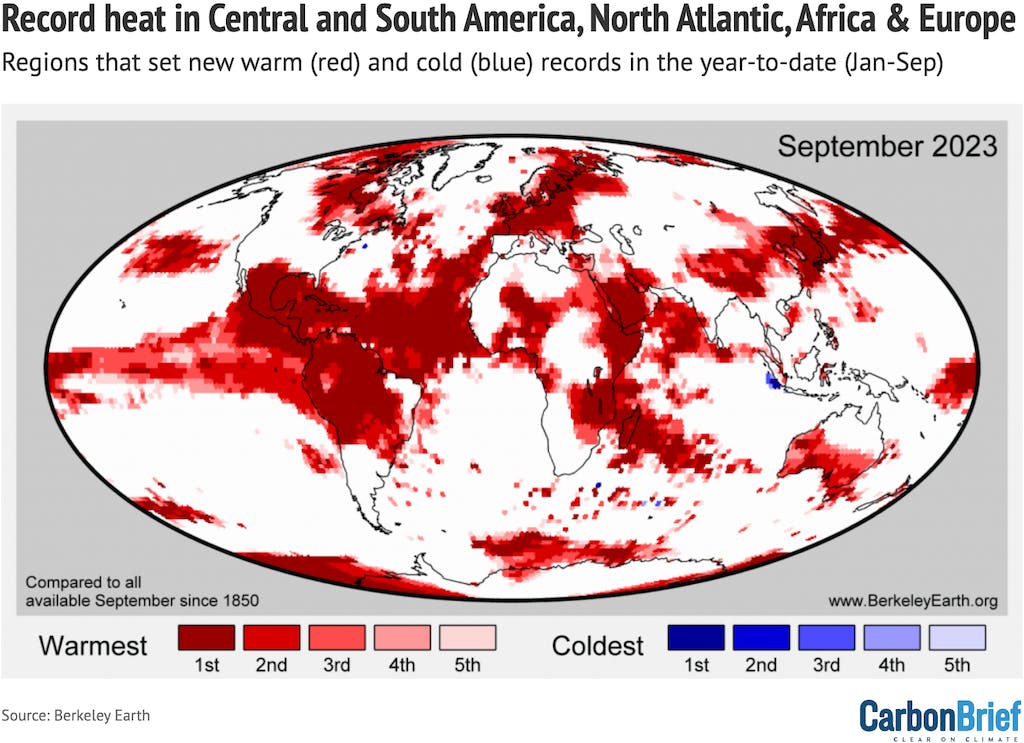
Map of year-to-date (January-September) regions that set new records (warmest through to fifth warmest). Note that no regions set cold records for the year-to-date in 2023. Credit: Berkeley Earth
In September alone, 77 different countries – mostly in Europe and the tropics – set new monthly average records.
Virtually everywhere on the planet saw warmer-than-usual temperatures for the year so far, with the exception of the western US, India and Greenland.
The tropical Pacific shows a strong characteristic “warm tongue” associated with El Niño over the first nine months of the year. The global temperature anomalies (changes) relative to the 1951-80 period used by Berkeley Earth are shown in the map below.
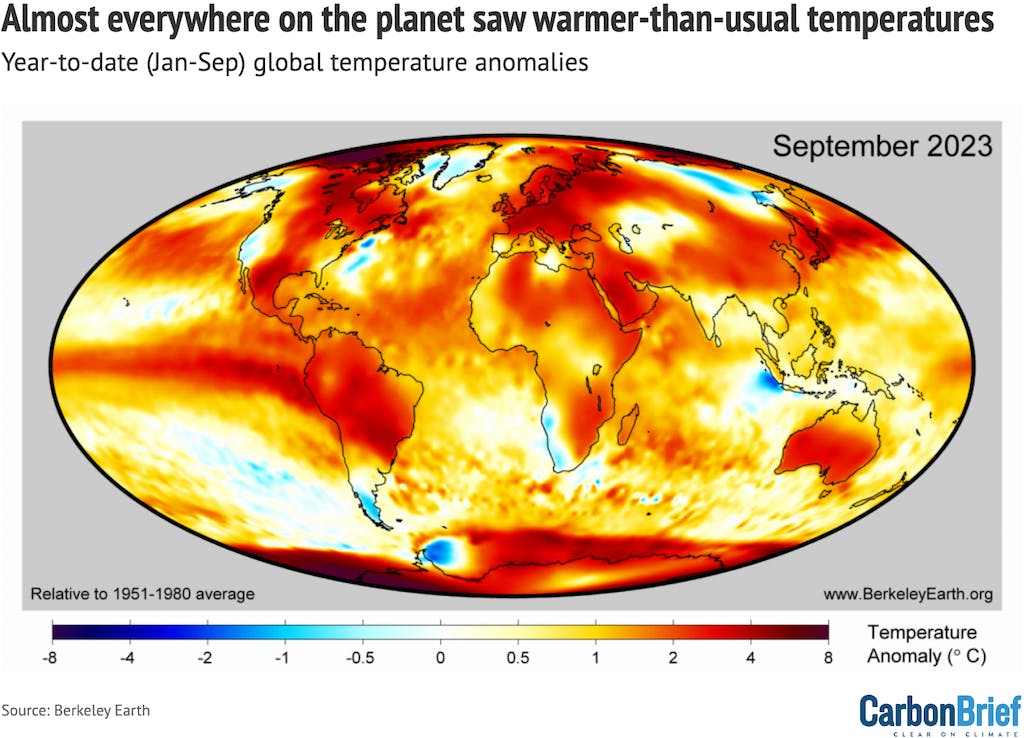
Map of year-to-date (January-September) global surface temperatures. Anomalies are shown relative to the 1951-1980 period following the convention used by Berkeley Earth. Credit: Berkeley Earth.
October continuing the record warm streak
While global temperature records are not yet in for the full month of October 2023, real-time reanalysis products increasingly allow scientists to track global temperatures on a daily basis.
Reanalysis pulls together a huge amount of data from satellites, weather balloons, aeroplanes, weather stations, ships and buoys to provide a detailed look at how the Earth’s climate is changing in real-time.
Modern reanalysis products, such as JRA-55 and ERA5, use state-of-the-art methods to produce records that align well with traditional surface temperature datasets over recent decades.
In the figure below, Carbon Brief shows the daily global temperature anomaly values from the JRA-55 reanalysis product for each day since the record began in 1958 (grey lines). It shows the current year to date (2023) in red and the prior record warm year, 2016, in blue. Nearly every single day since mid-June 2023 has been warmer than any prior days since the JRA-55 record began in 1958 – and, potentially, much further into the past.
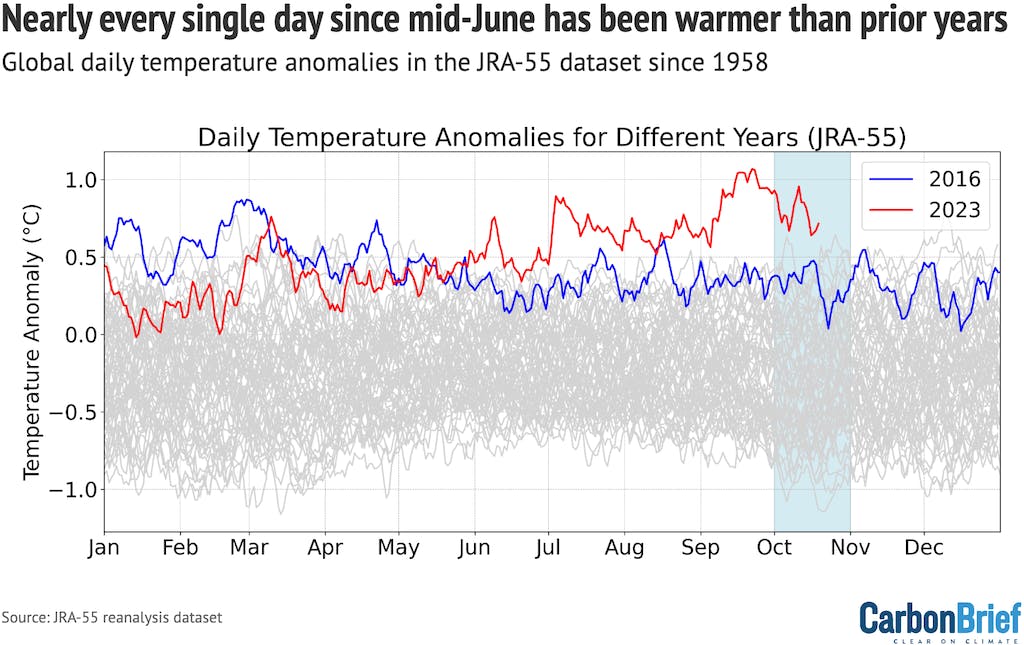
Daily global mean surface temperature anomalies from the JRA-55 reanalysis product, using its standard 1991-2020 baseline period. Lines show global surface temperature anomalies for each day since the record began in 1958 (grey), the current year of 2023 to date (red) and the previous record warm year in 2016 (blue). Chart by Carbon Brief.
The heat map below focuses on 2023, showing each day in the year, with columns representing each month. The red shading shows the temperature anomaly of each day, with darker shading indicating more extreme temperatures. The map highlights how extreme the prior four months (from July onward) have been compared to the prior period.
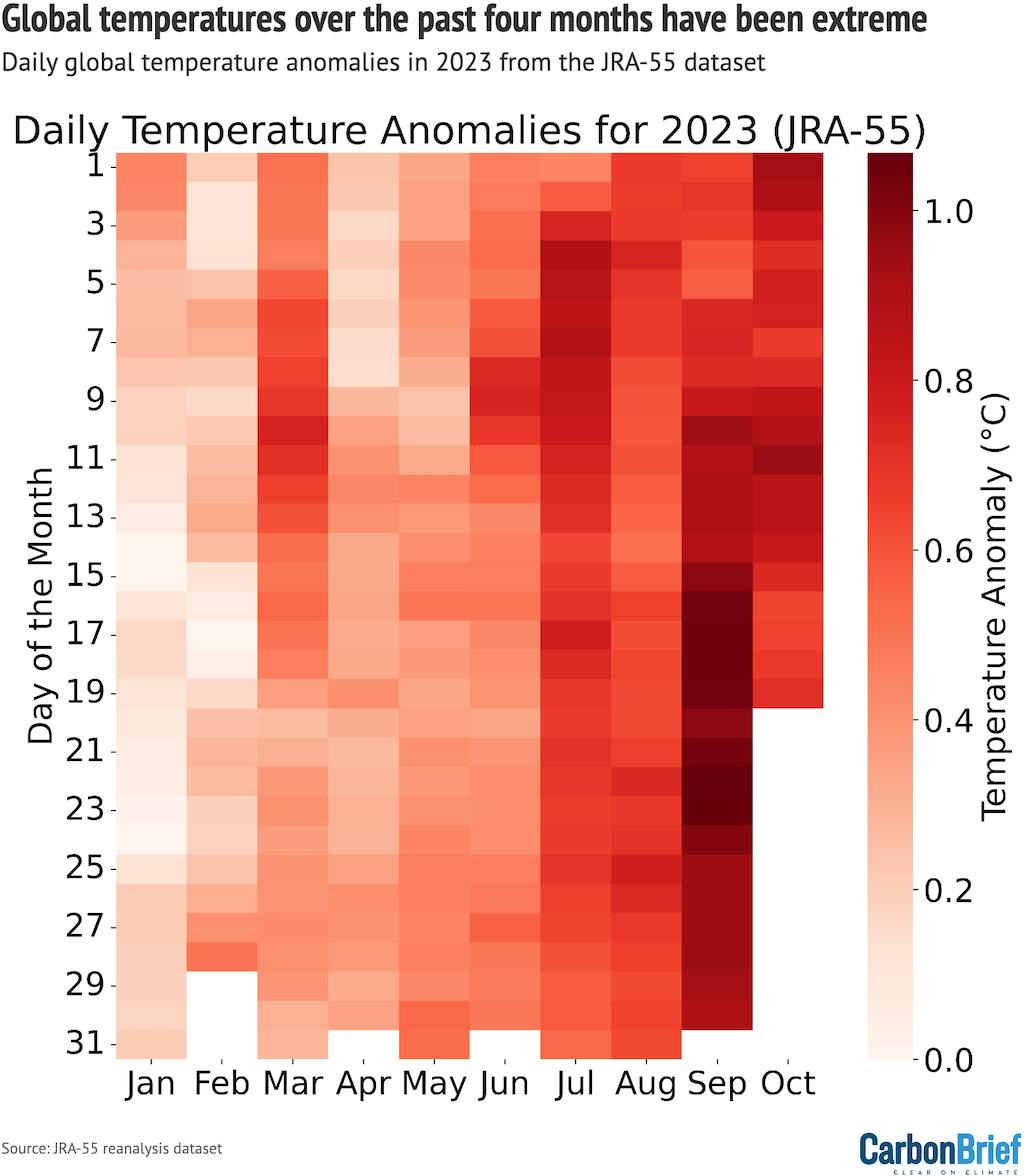
Daily global average surface temperature anomalies for 2023 from the JRA-55 reanalysis product, using its standard 1991-2020 baseline period. Chart by Carbon Brief.
With most of the data for the month of October now available in the JRA-55 reanalysis product, Carbon Brief estimates that October 2023 will be the warmest October on record, and is likely to exceed the prior record by at least 0.3C.
The figure below shows Carbon Brief’s estimate for October, with uncertainty intervals estimates based on the historical relationship between the first 19 days of the month available at the time of publication and the overall monthly average.
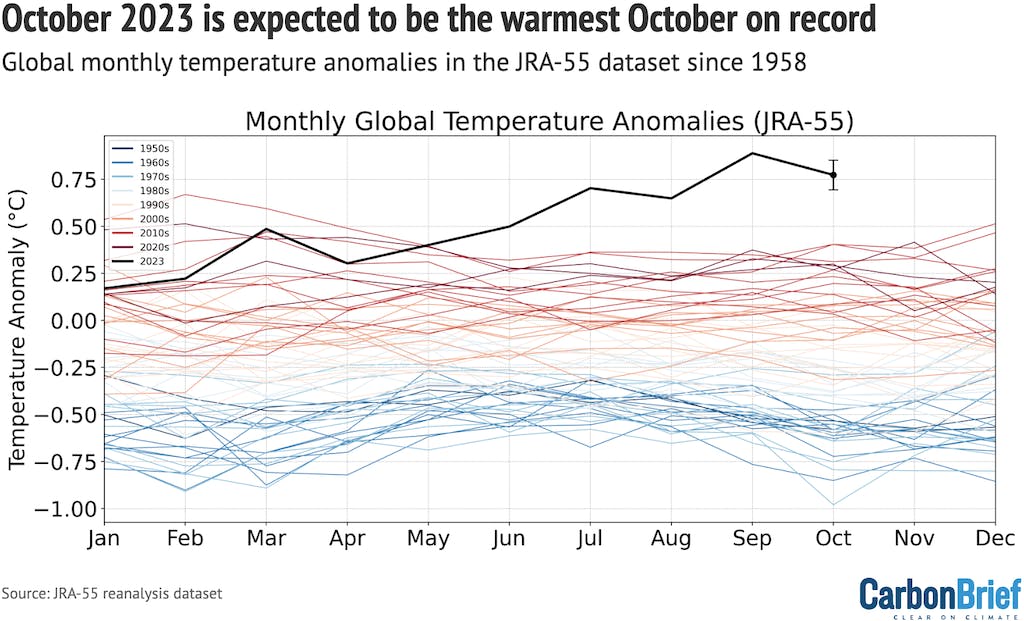
Monthly global mean surface temperature anomalies from the JRA-55 reanalysis product, using its standard 1991-2020 baseline period. Lines show global surface temperature anomalies for each year since the record began in 1958, with years coloured by decade. The current year (2023) is shown in black. Chart by Carbon Brief.
October is projected to not be quite as extreme as September’s record-shattering anomaly, but will still come in as the second highest anomaly of any month in 2023 to-date.
In addition to temperature anomalies, reanalysis products are able to provide an accurate near-real-time estimate of global absolute temperatures. The figure below shows the absolute temperature of each month of 2023 compared to all prior years in the record, with Carbon Brief’s October estimate and its uncertainties shown.
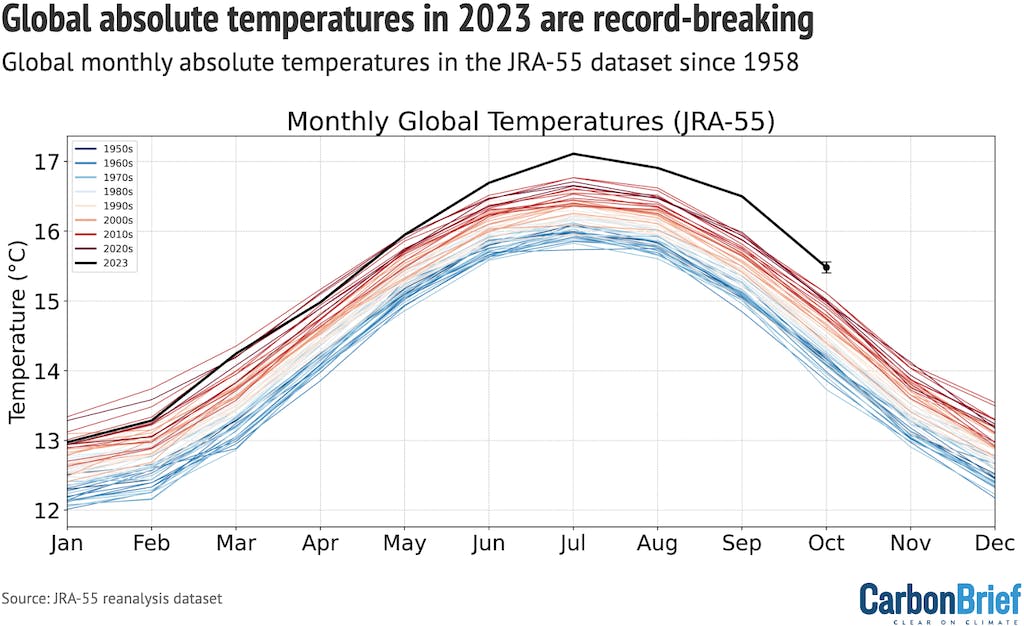
Monthly absolute global average surface temperatures from the JRA-55 reanalysis product. Lines show global surface temperatures for each year since the record began in 1958, with years coloured by decade. The current year (2023) is shown in black. Chart by Carbon Brief.
Unpacking the drivers of recent record warmth
The extreme surface temperatures seen over the past few months have triggered a broader debate in the scientific community around its potential drivers.
For example, the world has never seen a month exceed the prior monthly record by 0.5C – as experienced in September. The closest analogue is February 2016, where global temperatures beat the prior record by 0.47C.
However, February 2016 was shortly after the peak of a super El Niño event – when the effect of El Niño on global temperatures is expected to be the largest. September 2023, by contrast, occurred early in the evolution of the current El Niño event when the contribution to global temperatures is typically much smaller.
This has led to a search for alternative explanations of factors contributing to recent record warmth. While the rapid switch from modest La Niña conditions at the start of the year to growing El Niño conditions on top of human-driven warming remains the primary explanation, it cannot easily explain the full extent of extreme global temperatures over the past few months.
A number of different potential contributors to recent global temperature records have been identified, including an uptick in the 11-year solar cycle, an unusual volcanic eruption last year that put a large amount of water vapour into the stratosphere with minimal cooling sulphate aerosols, and a 2020 phaseout of planet-cooling sulphur dioxide in marine shipping fuels.
The figure below, developed by Dr Robert Rohde at Berkeley Earth, shows a current best-estimate of the impact of each of these effects over the past 10 years based on published studies to-date. The shading indicates a warming (red) or cooling (blue) influence on global temperatures.
While each of these factors are small on their own, their combined effects may be to add around 0.1C to global temperatures in 2023.
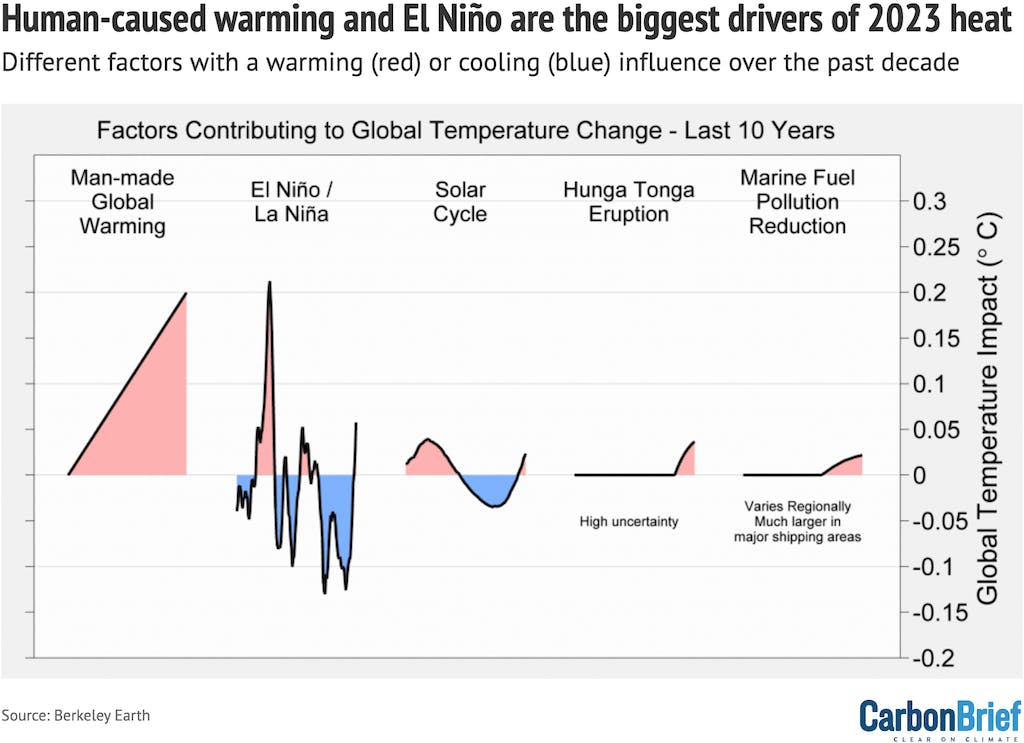
Estimated drivers of global surface temperature evolution over the past decade. Note that marine fuel pollution reduction should technically be part of human-caused global warming (which includes both greenhouse gas and aerosol emissions), but is separated out for clarity. Credit: Berkeley Earth
Temperatures are tracking climate model projections
Climate models provide physics-based estimates of future warming given different assumptions about future emissions, greenhouse gas concentrations and other climate-influencing factors.
The figure below shows the range of individual models forecasts featured in the Intergovernmental Panel on Climate Change’s (IPCC) fifth assessment report – known collectively as the CMIP5 models – between 1970 and 2030, with grey shading and the average projection across all the models shown in black. Individual observational temperature records are represented by coloured lines.
In these models, estimates of temperatures prior to 2005 are a “hindcast” using known past climate influences, while temperatures projected after 2005 are a “forecast” based on an estimate of how things might change.
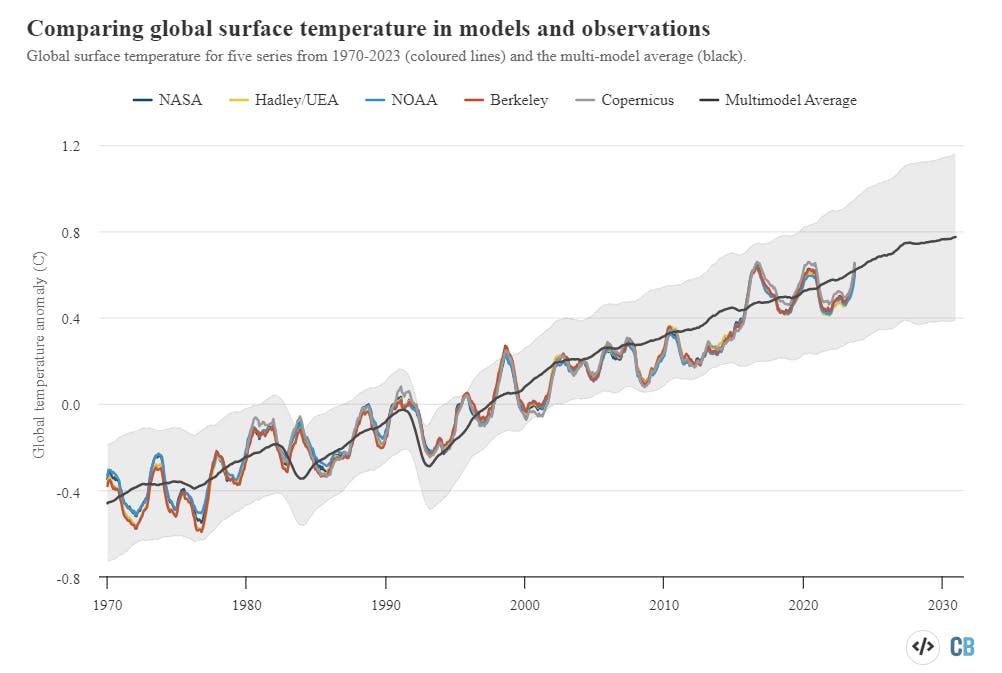
Twelve-month average global average surface temperatures from CMIP5 models and observations between 1970 and 2023. Models use RCP4.5 forcings after 2005. They include sea surface temperatures over oceans and surface air temperatures over land to match what is measured by observations. Anomalies plotted with respect to a 1981-2010 baseline. Chart by Carbon Brief.
While global temperatures were running below the pace of warming projected by climate models between 2005 and 2014, the past decade has been closer to the model average.
Currently the latter part of 2022 and early 2023 is suppressing the 12-month average compared to the most recent months, but observations are expected to be well above the model average by mid-2024.
Record high ocean heat content
Human-emitted greenhouse gases trap extra heat in the atmosphere. While some of this warms the Earth’s surface, the vast majority – around 93 per cent – goes into the oceans. About two-thirds of this accumulates in the top 700 metres, but some also ends up in the deep oceans.
The figure below shows annual OHC estimates between 1950 and present for both the upper 700 metres (light blue shading) and 700-2000 metre (dark blue) depths of the ocean.
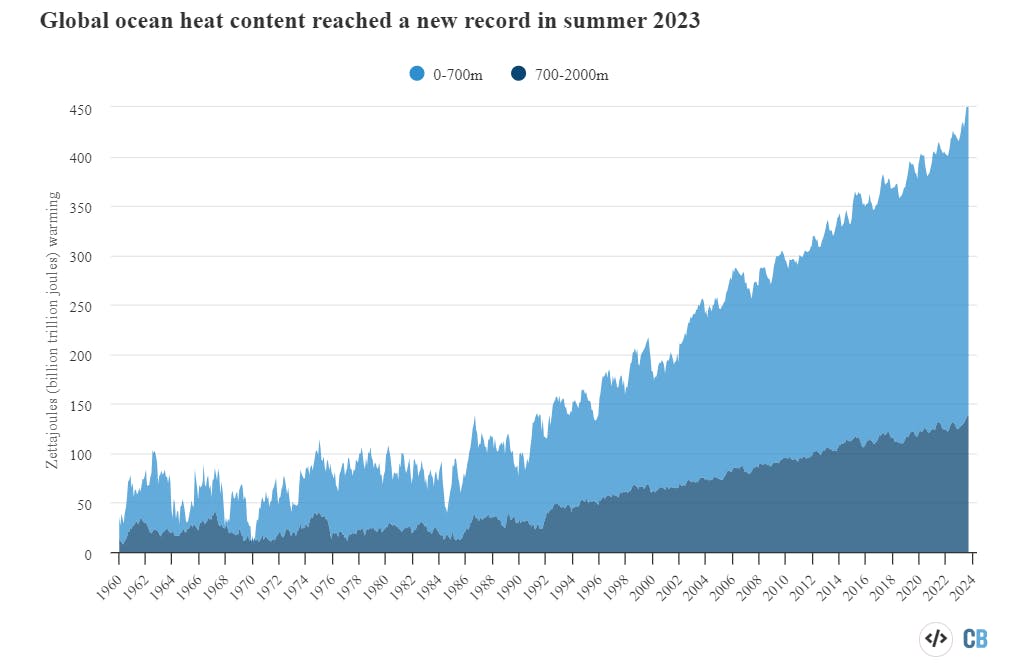
Monthly global ocean heat content (in zettajoules - billion trillion joules, or 10^21 joules) for the 0-700 metre and 700-2000 metre layers. Data from IAP. Chart by Carbon Brief.
In many ways, OHC represents a much better measure of climate change than global average surface temperatures. It is where most of the extra heat ends up and is much less variable on a year-to-year basis than surface temperatures.
Just about every year since 1991 has set a new OHC record, showing that heat has continued to accumulate in the Earth system as concentrations of atmospheric greenhouse gases have increased.
Over the last 12 months, ocean heat content has increased by 42 zettajoules, or around 72 times as much as the total energy produced by all human activities on Earth last year.
Record low Antarctic sea ice extent
Highly accurate observations of Arctic and Antarctic sea ice have been available since polar-observing satellites became available in the late 1970s.
The figure below shows both Arctic (red) and Antarctic (blue) sea ice extent in 2023, the historical range in the record between 1979 and 2010 (shaded areas) and the record lows (dotted black line).
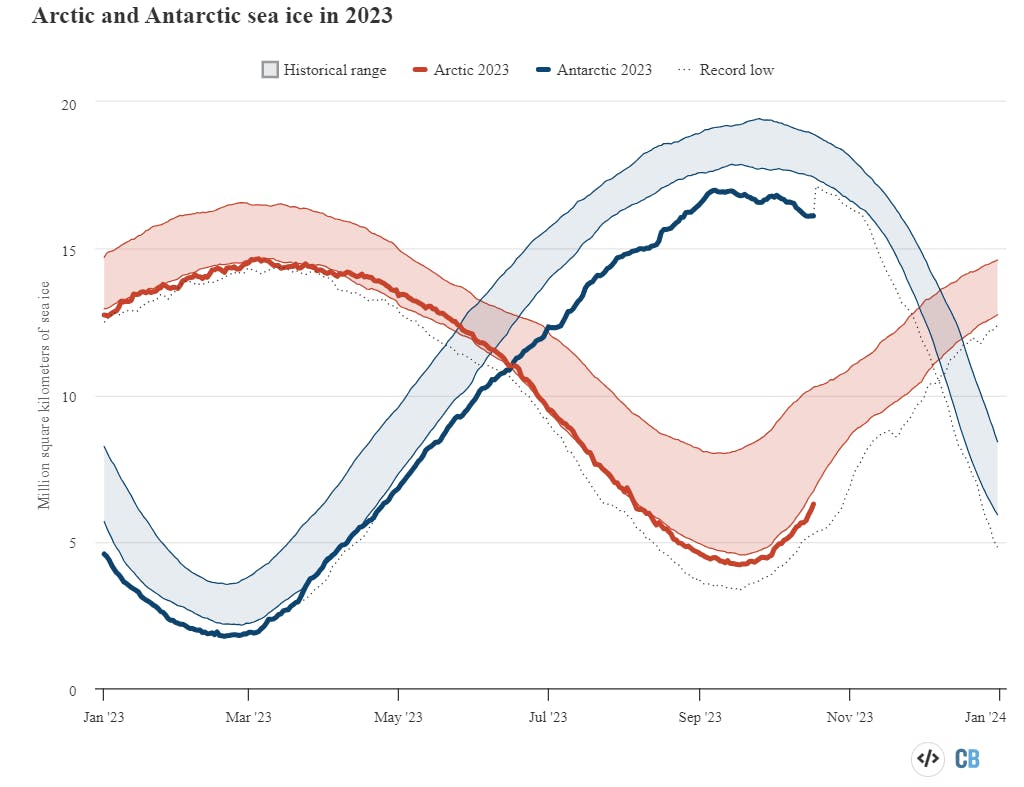
Arctic and Antarctic daily sea ice extent from the US National Snow and Ice Data Center. The bold lines show daily 2023 values, the shaded area indicates the two standard deviation range in historical values between 1979 and 2010. The dotted black lines show the record lows for each pole. Chart by Carbon Brief.
Arctic sea ice extent during the first three quarters of 2023 has been at the low end of the historical 1979-2010 range, but has not seen any record daily lows except for a few days in February and April.
The annual minimum sea ice extent in September was the sixth lowest on record, though still well above the record low set in 2012.
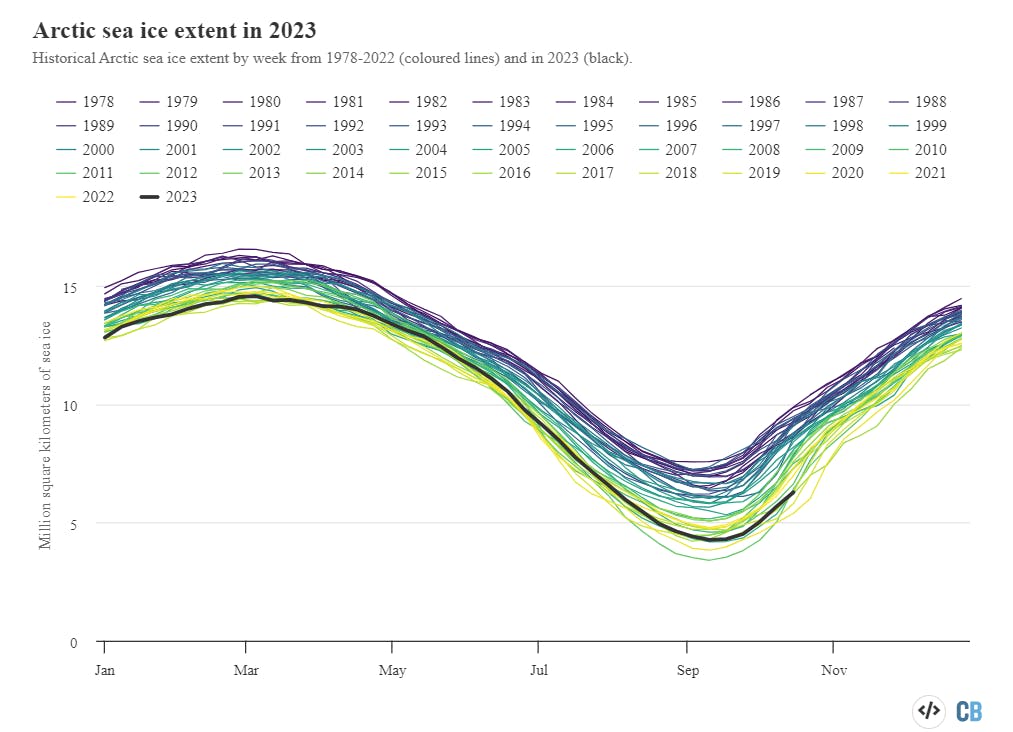
Weekly Arctic sea ice extent from the US National Snow and Ice Data Center. Chart by Carbon Brief.
Antarctic sea ice, on the other hand, has set new all-time low records for most of 2023, set a new all-time low extent in February 2023, and has been far below any prior levels ever since mid May.
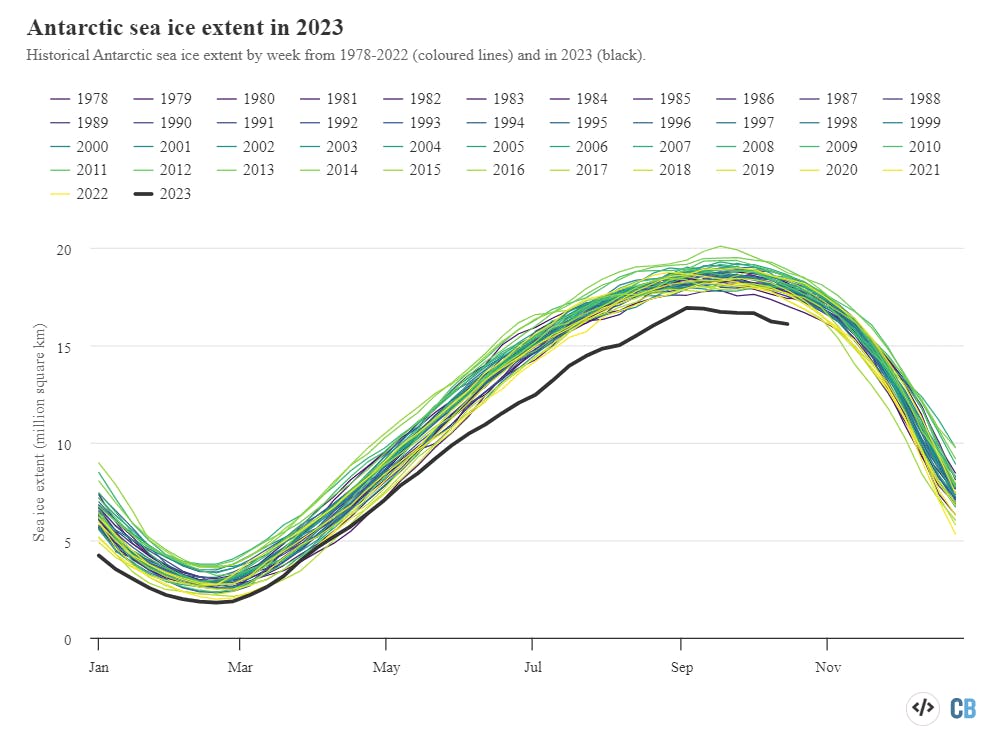
Weekly Antarctic sea ice extent from the US National Snow and Ice Data Center. Chart by Carbon Brief.
This story was published with permission from Carbon Brief.


