
Climate change is typically measured as the average global temperature increase relative to a “pre-industrial baseline”. The UN Intergovernmental Panel on Climate Change (IPCC), for example, uses the average temperature over 1850-1900 as their historical baseline. The planet has already warmed by around 1.2°C compared to this period.
The new study, published in Nature Climate Change, uses proxy data from sea sponges in the Caribbean Sea to create a record of ocean temperatures from 1700 to the present day. This data suggests that warming started 40 years before the IPCC’s pre-industrial baseline period began.
Based on this new record, the authors say “warming is 0.5°C higher than IPCC estimates”.
This means that “the global warming clock for emission reductions to minimise the risk of dangerous climate change has been brought forward by at least a decade”, the lead author told a press briefing.
However, many experts have warned that the framing of the study is misleading, arguing that the finding has no bearing on the Paris Agreement 1.5°C limit, because it specifically “describes temperature rise relative to the late 19th century”.
Prof Richard Betts, head of climate impacts research at the UK Met Office Hadley Centre, who was not involved in the study, tells Carbon Brief that, crucially, the study “does not mean that impacts of climate change will occur earlier than expected”.
Other experts raised doubts that the 0.5°C warming in the 1800s is human-caused, while many cautioned that proxy data from a single location should not be used to make assumptions about the entire planet.
The University of Oxford’s Prof Yadvinder Malhi, who was also not involved in the study, cautions that “the way these findings have been communicated is flawed, and has the potential to add unnecessary confusion to public debate on climate change”.
“
The big picture is that the global warming clock for emission reductions to minimise the risk of dangerous climate change has been brought forward by at least a decade.
Dr Malcolm McCulloch, emeritus professor, University of Western Australia
Shifting baselines
Humans have been releasing greenhouse gases into the atmosphere for centuries, causing global temperatures to rise.
In IPCC reports – considered the most authoritative summaries on climate science – scientists use a combination of land surface air temperatures and sea surface temperatures to assess changes in global mean surface temperatures (GMST).
The UN body reports global warming against a “pre-industrial baseline” of 1850-1900. It describes this baseline as “a pragmatic choice based upon data availability considerations” – in part because much of the observed climate data they use is only available from 1850.
For example, the Met Office’s HadSST4 dataset – one of the three datasets used in IPCC estimates of sea surface temperatures – goes back as far as 1850.
The IPCC also recognises that “both anthropogenic and natural changes to the climate occurred” before the 1850-1900 baseline. For example, in its 2021 report on climate science, the IPCC estimates that between 1750 and 1850-1900, GMST increased by around 0.1°C. Of this, human activity was responsible for 0.0-0.2°C, it says.
Nonetheless, researchers have typically followed suit in using the 1850-1900 average as their “pre-industrial baseline” to measure global warming.
In 2015, countries agreed under the Paris Agreement to hold the increase in the global average temperature to well below 2°C above pre-industrial levels and pursue efforts to limit warming to 1.5°C. “Pre-industrial” was not clearly defined in the agreement, but it has generally been taken to mean the average temperature over 1850-1900.
However, some scientists argue that the “pre-industrial baseline” period should begin before 1850.
The new study uses proxy data taken from sea sponges from the Caribbean sea, to present a timeseries of regional ocean temperatures from 1700 to the present day. Scientists collected sclerosponges from the ocean mixed layer – a region of ocean where heat is exchanged between the atmosphere and the ocean interior.
Between 1700-90 and 1840-60, the proxy data shows ocean warming of around 0.9°C, according to the study. In the intervening time, there was some cooling, largely caused by volcanic eruptions, the authors say.
The plot below shows the proxy data (blue) from the year 1770, alongside the HadSST4 observed temperature record (purple), which begins in 1850, relative to a 1961-90 reference period. The authors have applied a 0.9°C “offset” to their proxy data to account for pre-industrial temperature increase.
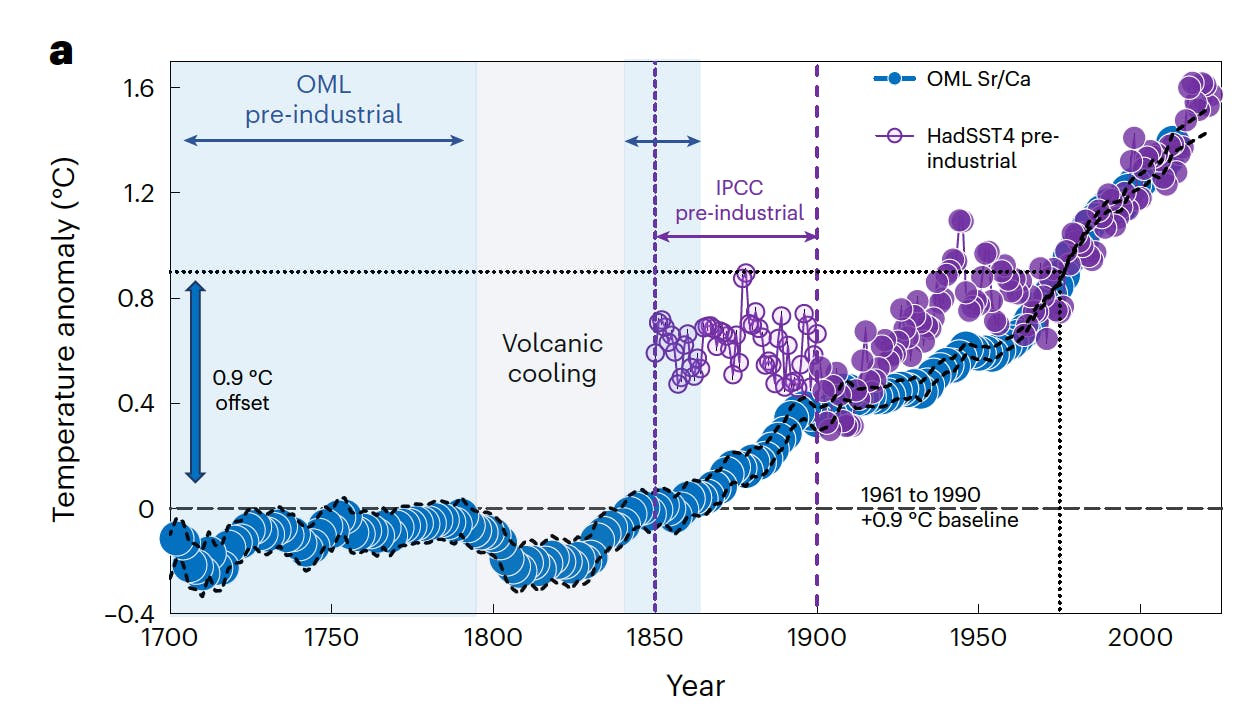
Temperature anomalies compared to the 1961-90 average, according to the HadSST4 observed temperature record (purple) since 1850 and the proxy sponge data (blue) since 1700 to the present day. The authors have applied a 0.9C “offset” to their proxy data to account for pre-industrial temperature increase. Source: McCulloch et al (2024).
By comparing their proxy data against existing records of global temperature changes, the authors find “strong empirical evidence that the Caribbean ocean mixed layer has warmed proportionately to the average global increase in sea surface temperature, over the last ~50 years”.
The authors assume that the 0.9°C offset “can be applied to land-air as well as the ocean mixed layer anomalies”, therefore concluding that GMST increased by 0.9°C between 1700-1860 and 1961-90.
Meanwhile, global ocean temperatures measured using HadSST4 show only 0.4°C of warming relative to the IPCC’s 1850-1900 pre-industrial period.
As such, the authors suggest that human-caused warming to date is actually 0.5°C higher than IPCC estimates.
Dr Malcolm McCulloch – an emeritus professor at the University of Western Australia and lead author on the study – told a press briefing that, according to his study, the 1.5°C Paris temperature threshold has already been crossed in around 2010-12.
He continued:
“It means that now, temperatures are at least 1.7°C above the pre-industrial level. It also means that the 2°C target will be passed in late 2020 unless there are major reductions in emissions…
“The big picture is that the global warming clock for emission reductions to minimise the risk of dangerous climate change has been brought forward by at least a decade”.
However, many scientists are concerned about this framing of the study.
Warming limits
Dr Friederike Otto, who was not involved in the study, is a senior lecturer in climate science at Imperial College London’s Grantham Institute. She says the paper “does not tell us anything about whether we have exceeded the 1.5°C temperature limit set in the Paris Agreement”.
She continues:
“That limit was established as the threshold of unacceptably dangerous warming and describes temperature rise relative to the late 19th century. If this study has indeed identified warming from before the mid-1800s, that doesn’t mean the planet is any closer to breaking the 1.5°C limit as it is widely understood.”
(The IPCC best estimate – in all but the highest emission scenario – is that global warming will pass 1.5°C in the first half of the 2030s.)
Mahli adds:
“Our models of climate warming impacts are based on warming relative to 1850-1900 and moving the baseline definition of pre-industrial does not make these expected impacts worse…
“It is the date of the reference period that matters rather than whether it is labelled pre-industrial or not. The period 1850-1900 is a period of relatively reliable global data when industrial era human-caused climate change was likely negligible.”
Dr Andrew King is a senior lecturer in climate science at the University of Melbourne and was not involved in the study. He tells Carbon Brief that the findings of the study do not have any implications for the Paris Agreement warming limits, because these were “written in 2015 with a view to limiting further global warming from that point onwards”.
He adds:
“While the lack of clarity on what pre-industrial means was problematic, it doesn’t really affect that goal or any of the analyses on climate impacts at global warming levels that have been performed.”
King also tells Carbon Brief that the authors have not demonstrated that pre-1850s warming is due to human activity.
Malhi agrees that “this early industrial-era warming, if real, is almost certainly not human-caused”. He notes that human-caused emissions over 1750-1900 account for only 2.5 per cent of total emissions to date, and says they are “unlikely to have caused substantial warming compared to the 1.4°C of warming caused by the remaining 97.5 per cent of cumulative emissions”.
Dr Duo Chan, a lecturer in climate sciences at the University of Southampton, also advises “caution” when interpreting the results, noting that “this new warming estimate does not align” with historical estimates of the different factors that affect the climate.
He notes that, according to Berkeley Earth temperature estimates, the land warmed by around 0.05C per decade over 1850-1900. The new proxy data from the sponges suggests that the ocean warmed almost twice as quickly as the land over this time – a “puzzling observation given the ocean warms more slowly than land”, he says.
Dr Zeke Hausfather, Carbon Brief’s contributing science writer, adds that the study authors are “conflating ocean mixed layer temperature with sea surface temperature in a way that is confusing”. He adds that “their reconstruction also seems a bit at odds with other palaeoclimate reconstructions – such as PAGES2k – that do not see large differences in pre-1900 temperatures”.
The sclerosponge record
Coralline sclerosponges are an ancient type of calcifying sea sponge which can live for hundreds of years. As they grow, chemicals called strontium and calcium build up in their skeletons. The ratio of strontium to calcium in their skeletons is higher during warm periods and lower during cool periods.
Scientists collected live specimens of sclerosponge from the Caribbean sea and analysed the ratios of strontium to calcium in their skeletons to reproduce a timeseries of ocean temperatures in the region from the year 1700 to the present day.
Dr Amos Winter is a professor of Earth and environmental systems at Indiana State University and author on the study. He told the press briefing that there is no such thing as a “perfect proxy”, but said the sclerosponge record is “as good as possible – the holy grail of reconstruction”.
He explained that the Caribbean is “the ideal location to measure global trends”. According to the paper, the region is “ideally positioned” to have a “minimal” impact from the Atlantic Meridional Overturning Circulation, while “still registering the broader effects” of the El Niño-Southern Oscillation climate phenomenon.
He adds that the sclerosponge temperature reconstruction is “very robust” when compared to other assessments of temperature trends.
Dr Gavin Schmidt, director of the NASA Goddard Institute for Space Studies, says that the new data is a “useful addition to the database” of palaeoclimate proxies. However, he adds:
“Estimates of the global mean temperatures before 1850 require multiple proxies from as wide a regional variation as possible, thus claims that records from a single record can confidently define the global mean warming since the pre-industrial are probably overreaching.”
Prof Gabi Hegerl, a professor of climate system science at the University of Edinburgh, says that the paper presents a “nice new record” of ocean temperatures, but says that “the interpretation in terms of global warming goals overstretches it”.
She warns that “a single location cannot substitute global data, as climate varies across the globe, which is why the only way to measure global temperature is to get data from across the globe”.
Similarly, Hausfather calls the finding “interesting”, but says it “should be combined with other proxy records in a larger synthesis before it will change our prevailing views here”.
This story was published with permission from Carbon Brief.