The third part of the IPCC’s 6th assessment report, known as Working Group III (WG3), provides a detailed view of possible futures.
For example, it says that current policies put the world on track for a central estimate of around or a bit below 3C warming by 2100, though climate system uncertainties mean that warming of as low as 2.3C or above 4C cannot be fully ruled out.
If countries meet their current nationally determined contributions (NDCs) for 2030 under the Paris Agreement it would shave a few tenths of a degree off future warming – but a large gap remains between 2030 commitments and the magnitude of emissions reductions needed to put the world on track for below 2C or 1.5C warming by 2100.
Stabilising global average temperature will require reducing carbon dioxide (CO2) emissions to net-zero. Scenarios limiting the world to below 2C generally reach net-zero CO2 in the “early 2070s”, while those limiting warming to 1.5C reach net-zero in the “early 2050s”. If the world reaches net-zero greenhouse gas (GHG) emissions then global temperatures will fall.
WG3 explores a wide range of energy system and emissions pathways to limit warming to 1.5C or below 2C, including worlds with large amounts of net-negative emissions and carbon dioxide removal (CDR), worlds where fossil fuels are eliminated rapidly in favour of renewable energy, and worlds where global energy demand is sharply reduced.
Nearly all scenarios considered within WG3 that limit warming below 2C rely on some degree of CDR to accelerate the pace of emissions reductions, to offset residual emissions, and to provide the option for net negative CO2 emissions in case global temperatures need to be brought back down.
However, compared to past IPCC reports, WG3 includes a more thorough exploration of models where more rapid emissions reductions are pursued and CDR is more limited.
New climate categories and ‘illustrative mitigation pathways’
WG3 draws on a database of more than 3,000 different future emissions pathways. They are primarily generated by integrated assessment models (IAMs) that examine energy technologies, energy use choices, land-use changes and societal trends that cause – or prevent – greenhouse gas emissions. (For more details on how IAMs work, see Carbon Brief’s detailed Q&A).
Of these, approximately 2,266 scenarios had the global scope needed for the assessment (rather than only modelling regional energy systems), with 1,686 scenarios passing a vetting process designed to screen out models that disagreed with historical data or had unrealistic assumptions about future changes. Finally 1,202 scenarios had sufficient information to calculate a broad range of future greenhouse gas emissions and global climate outcomes.
These scenarios are broadly divided into eight different “climate categories” based on 21st century warming outcomes – labeled C1 through to C8. These assignments are based on the use of climate model emulators called MAGICC and FaIR, as the IAMs do not calculate temperature outcomes themselves.
In addition to the climate categories, seven illustrative pathways (IPs) were defined representing outcomes under policies in place today (Cur-Pol), outcomes if 2030 commitments are met but limited additional climate policies are enacted (Mod-Act), and five deep mitigation strategies that limit warming to below 2C or to 1.5C using different types of approach.
The table below shows a number of key characteristics of each climate category C1-C8 and the relationship between these categories and the illustrative pathways. For each category, it highlights the median value across all relevant model pathways, as well as the range (5th to 95th per centile) across all models in each category in brackets. (More details can be found in Table SPM.1 of the report.)
Characteristics include: the number of scenarios available; the cumulative CO2 emissions between 2020 and 2100; the amount of peak warming and 2100 warming; the range of years during which global emissions peak and when they reach net-zero; and the amount of cumulative net-negative emissions – the difference between remaining positive emissions and negative emissions from CDR during years when there is more negative than positive emissions.
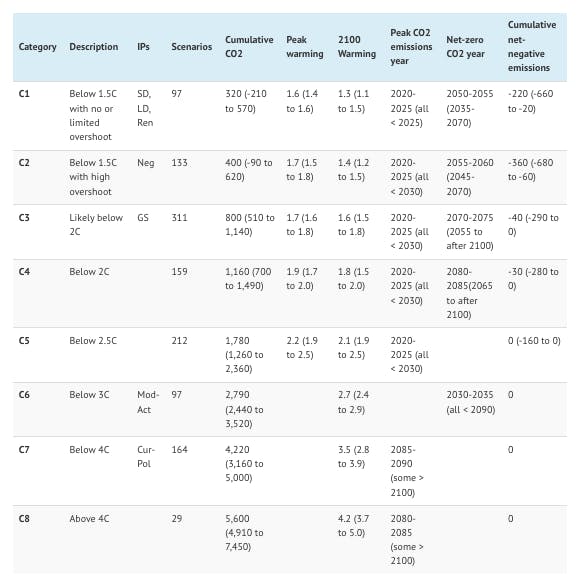
Characteristics of scenarios in each of the climate categories, including a mapping between categories and illustrative pathways. Median values across all models in each category are shown, as well as 5th to 95th percentile values in parentheses. Source: Adapted by Carbon Brief from IPCC (2022) Table SPM.1.
Three of the illustrative pathways – “shifting development pathways” (SP), low demand (LD), and high renewables (Ren) – produce climate outcomes that limit warming to 1.5C with “no or limited overshoot” (C1).
A pathway featuring extensive use of net-negative emissions (Neg) results in warming below 1.5C in 2100, but with “high overshoot” during the 21st century (C2), while a pathway characterised by a gradual strengthening of current policies (GS) likely (>66% chance) limits warming to below 2C by 2100 (C3). The Mod-Act pathway – in which countries meet their 2030 commitments, but with little additional climate action – likely results in warming of between 2.5C and 3C by 2100 (C6).
The Cur-Pol pathways, where current policies are continued, turns out to be tricky to categorise. The scenario ends up with a best-estimate warming of almost precisely 3C in 2100, making it overlap with both the 2.5C-3C (C6) and 3C-4C (C7) categories, either on the high end of the former or the low end of the latter.
More broadly, as WG3 lead author Prof Detlef van Vuuren tells Carbon Brief, current policy scenarios assessed by WG3 range from 2.2C to 3.5C in 2100, “consistent with the C5-C7 categories”. (See: Where is the world headed today?)
The figure below shows both CO2 emissions (left) and total greenhouse gas emissions (right) for the illustrative pathways (coloured lines), as well as the broader range of current policy scenarios (grey wedge), C3 (orange wedge) and C1 (green) scenarios.
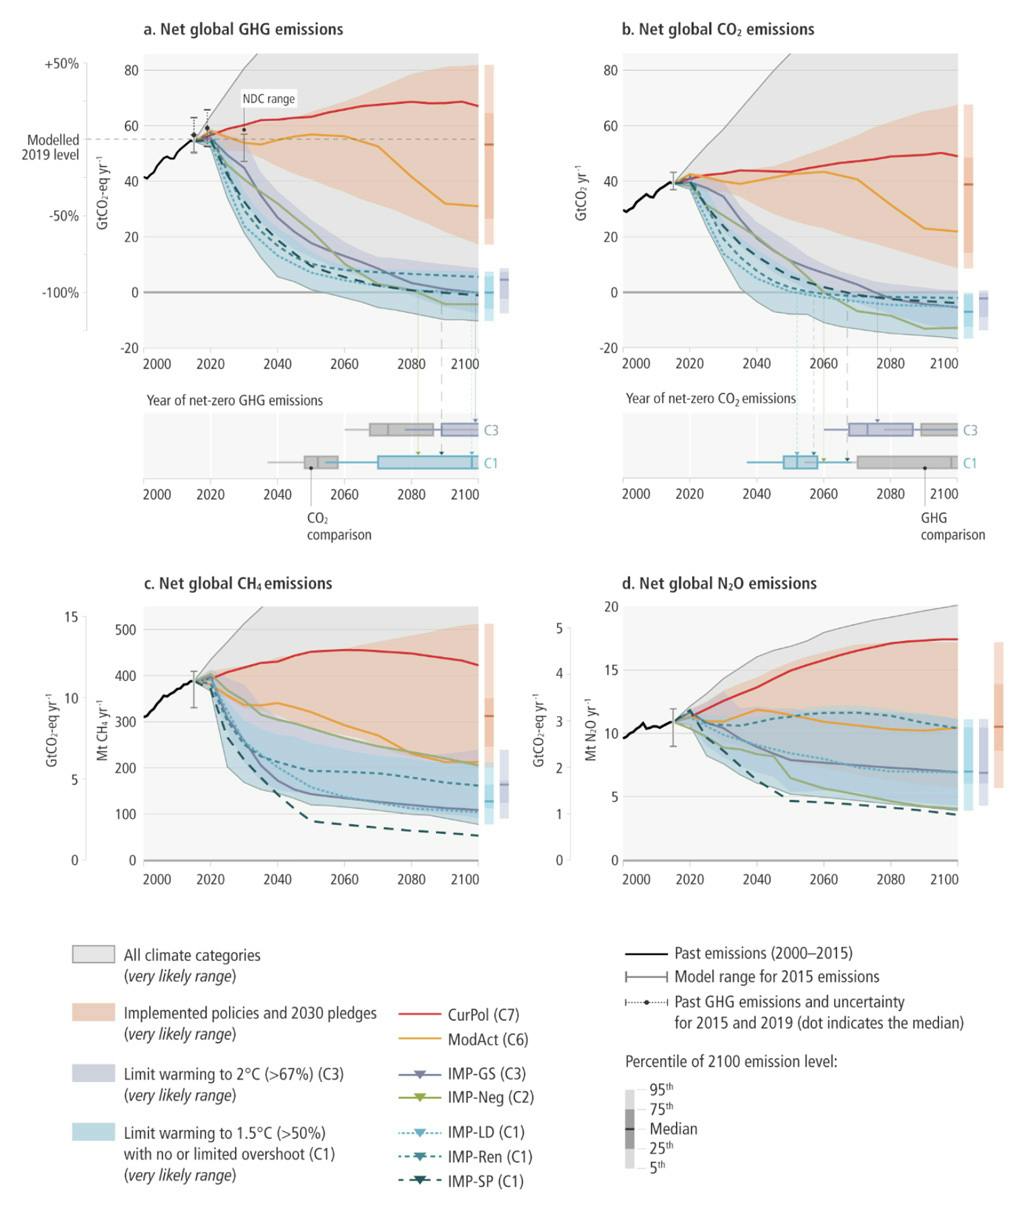
Net CO2 emissions (positive emissions minus CDR) (left) and net GHG emissions (right) under the seven illustrative pathways. Source: IPCC (2022) Figure SPM.5.
Although the report outlines various ways to limit warming to 1.5C by 2100 (C1-C2), all of these pathways show deep emissions reductions over the next few decades, with both global CO2 and all GHG emissions peaking “between 2020 and at the latest before 2025” and CO2 emissions declining between 25% (Neg) and >50% (LD) by 2030 relative to 2020 levels.
Overall, in scenarios staying below 1.5C with no or limited overshoot, global GHG emissions fall to 43% below 2019 levels by 2030 and 84% by 2050. In these scenarios, global CO2 falls 48% by 2030 and to net-zero “in the early 2050s”, says the report. Methane emissions fall 34% by 2030.
The more intermediate GS pathway, which likely limits warming to 2C but not 1.5C, has global emissions declining by around 14% by 2030 relative to 2020 levels. More broadly, it says keeping warming below 2C means cutting CO2 emissions 50% “in the 2040s” and to net-zero “around the early 2070s”.
Each of the five mitigation-focused illustrative pathways has a somewhat different approach to cutting emissions, energy use and energy production. GS has a relatively slow phase-out of fossil fuels compared to the others, with high future energy demand primarily met by renewables and a fair amount of CDR deployed late in the century – including lots of direct air capture.
Neg relies heavily on biomass and bioenergy with carbon capture and storage (BECCS) for CDR. It also has a relatively slow phase out of fossil fuels and high future energy demand. Ren has a rapid phaseout of fossil fuels, more moderate future energy demand that is primarily met by renewables, plus more limited deployment of CDR.
Finally, LD and SP both have large reductions in future energy demand and rapid fossil fuel phaseouts, with LD including an even faster fossil fuel use exit with limited negative emissions other than land use change (LUC). SP has more reliance on late-century CDR.
The figure below shows the amount of positive emissions (orange, red, and brown) and CDR (purple, blue, and green) over time in the illustrative pathways.
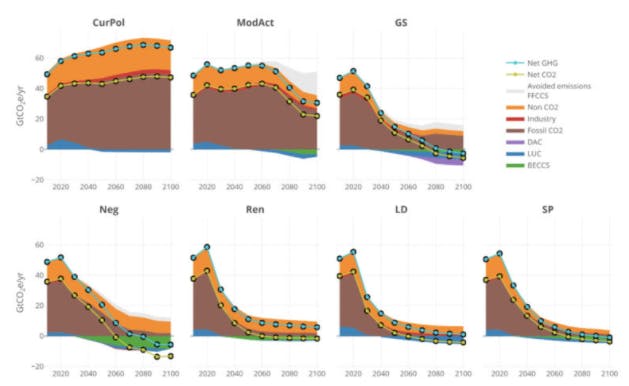
Greenhouse gas emissions by source (non-CO2 emissions, industry, and fossil CO2) and CDR (direct air capture, land use change, and bioenergy with carbon capture and storage) over time under each illustrative pathway. Source: IPCC (2022) Figure 3.7.
Each illustrative pathway and climate category has a range of possible climate outcomes, depending on two areas of uncertainty. First, the uncertainty in emissions across all scenarios in a climate category. Second, climate system uncertainties that depend on how sensitive the climate is to CO2 and other GHG emissions and how carbon cycle feedbacks might change as the Earth warms.
In addition to these new WG3 scenarios, the IPCC WG1 provided “assessed warming” estimates for five different future climate scenarios based on Shared Socioeconomic Pathways (SSPs). The SSPs reflect five specific emissions scenarios with differing end-of-century outcomes and are used by complex earth system models to simulate various aspects of the changing climate.
The WG3 scenarios, by contrast, explore a much wider variety of possible emissions futures, but are evaluated using simpler climate model emulators that only provide global average temperature changes.
The figure by Carbon Brief below provides a comparison between the possible amount of warming that may occur in the year 2100 under each of the different IP, climate category, and SSP scenarios. The color of the bar indicates the type of scenario (IP, climate category, or SSP), the dot gives a central warming estimate, the bars (when available) show the range of warming across different emissions scenarios in the category, and the whiskers show the range of warming accounting for climate system uncertainties.
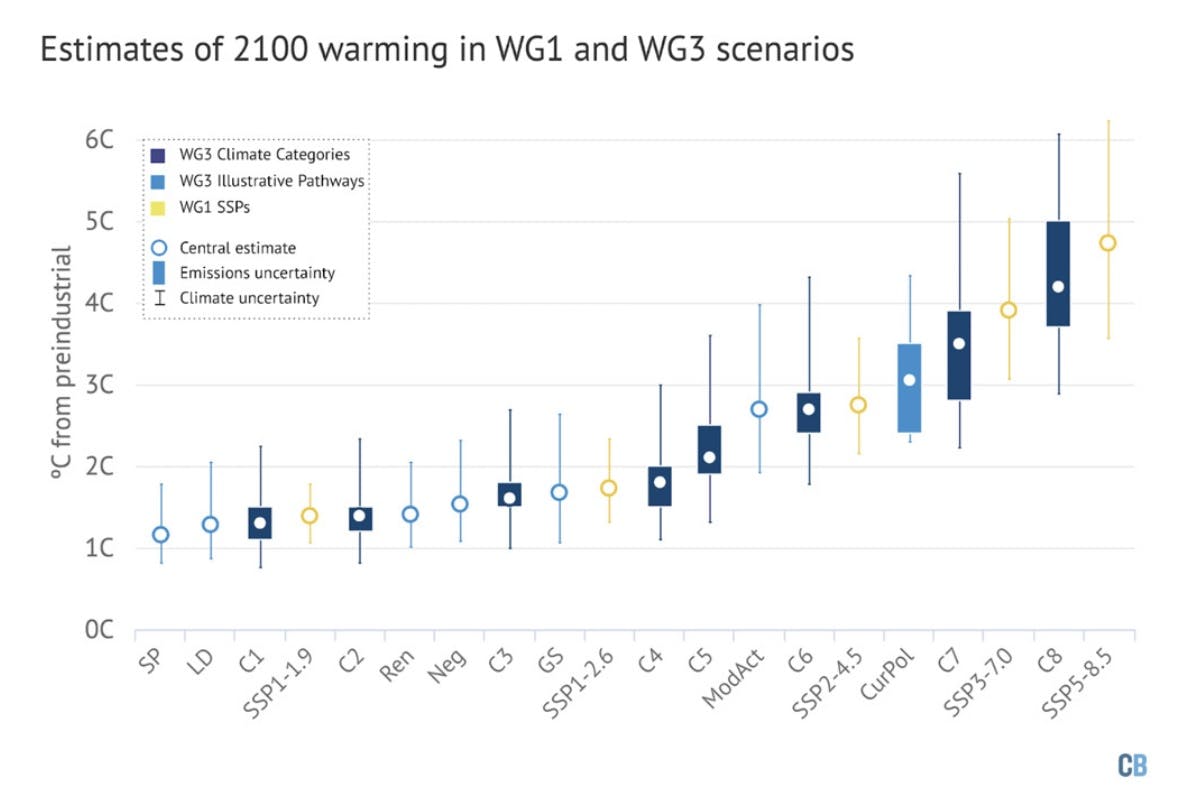
Warming in 2100 relative to the preindustrial (1850-1899) period for illustrative pathway, climate category and SSP scenarios. SSPs show the assessed warming reported in WG1. Cur-Pol shows both the Cur-Pol scenario (central estimate and climate uncertainties) as well as the range of outcomes across the emissions uncertainty associated with all current policy scenarios in WG3 (solid bar). Chart by Carbon Brief using Highcharts.
There are a few important things to note in this figure. First, the climate categories and illustrative pathways provide a detailed look at a wide range of scenarios (SP to C4) that are “more likely than not” to limit warming to below 2C by 2100, similar to SSP1-1.9 and SSP1-2.6.
Both Mod-Act and Cur-Pol scenarios are most similar to SSP2-4.5, while relatively few scenarios in WG3 – only a subset of C8 – produce warming as high as SSP5-8.5.
These new WG3 scenarios can also be compared to those in the 2018 IPCC special report on 1.5C (SR15). The SR15 “below 1.5C” and “1.5C with low overshoot” scenarios correspond to the C1 climate category in WG3. The “1.5C with high overshoot” scenarios from SR15 map to C2, the “lower 2C” scenarios to C3 and the “higher 2C” scenarios to C4. The P1 and P2 illustrative pathways in the SR15 fall into the C1 climate category, while the P3 and P4 pathways fall into C2.
Moving away from high-emissions pathways
While the IPCC AR6 WG1 was reluctant to discuss the likelihood of particular emissions outcomes, this question is taken up in much more detail in WG3.
Specifically, WG3 provides an in-depth exploration of what levels of future warming are implied by current policies and commitments. It finds that current policies (or, as the report puts it, the “trend from implemented policies until the end of 2020″) are consistent with a central estimate of warming – excluding climate system uncertainties – between 2.2C and 3.5C in 2100. Rather than wind back the clock to imagine a world without any climate policy, the scenarios considered by WG3 are increasingly incorporating implemented climate policies.
This has the effect of making higher-end climate outcomes – C7 and particularly C8 – notably less likely. The WG3 points out that the highest-end emissions scenarios, RCP8.5 and SSP5-8.5, “do not represent a typical ‘business-as-usual projection but are only useful as high-end, high-risk scenarios”, and that “the rapid development of renewable energy technologies and emerging climate policy have made it considerably less likely that emissions could end up as high as RCP8.5”.
At the same time, it suggests that these high-end scenarios can be useful to explore cases where existing climate policies are rolled back, or strong carbon cycle feedbacks result in extreme warming under a more plausible emissions scenario.
The WG3 authors suggest that no-climate-policy reference scenarios can be an important tool for assessing mitigation costs, but that “as countries move forward with climate policies of varying stringency, no-climate-policy baselines are becoming increasingly hypothetical”.
However, the range of outcomes under current policies still pose significant risks to human and natural systems. Climate system uncertainties are large enough that it is difficult to fully rule out warming above 4C in the absence of stronger future climate policy.
The report makes it clear that a failure to peak and reduce emissions in the coming decade will put Paris Agreement goals increasingly “out of reach”.
Where is the world headed today?
The current policy scenarios assessed in WG3 (including Cur-Pol) imply a relative flattening of emissions in the future compared to the growth over the past few decades, with CO2 emissions in 2100 anywhere between 25% below and 33% above current levels.
However, current policies represent something of a moving target and older modelling exercises may not capture commitments made in the lead-up to or at the COP26 conference, for example.
In addition to the scenarios in the WG3 database, the report cites two recent reviews of current policy scenarios. The first, by Sognnaes et al, finds that current policies would see warming reach a median level of between 2.2C and 2.9C. The second, by Höhne et al, finds a range of 2.2C to 3.2C; however the upper end of this range came from the 2020 UNEP Emissions Gap Report, which was revised downward in its 2021 version to a range of 2.1C to 3C.
These ranges suggest that there are “deep uncertainties involved with modelling temperature outcomes of 2030 policies through to 2100”, making it difficult to precisely determine the likely warming outcomes implied by policies in place today, the report says.
Countries have made NDC commitments for 2030 under the Paris Agreement that go beyond policies in place today, creating what the report refers to as an “implementation gap”.
There is also a large “emissions gap” between current commitments and what would be needed to meet the Paris Agreement goals. If current pledges are followed until 2030, it will become “impossible” to limit warming to 1.5C with no or limited overshoot, the report says with high confidence:
“Global GHG emissions in 2030 associated with the implementation of nationally determined contributions (NDCs) announced prior to COP26 would make it likely that warming will exceed 1.5C during the 21st century. Likely limiting warming to below 2C would then rely on a rapid acceleration of mitigation efforts after 2030.”
It finds that 2030 NDCs imply an emissions gap of between 29 and 26GtCO2e per year by 2030, relative to a scenario consistent with limiting warming to 1.5C with no or limited overshoot.
In effect, if NDCs are not strengthened the world will likely overshoot 1.5C by between 0.15C and 0.3C, the report explains, requiring a heavy reliance on net-negative CO2 emissions via CDR later in the century to bring temperatures back down below 1.5C by 2100.
Even limiting warming to 2C becomes difficult in this scenario, as it would imply a rate of emissions reductions after 2030 that is a full 70% higher than scenarios that assume immediate action to reduce emissions, the report says.
The emissions gap between 2030 NDCs and scenarios that likely limit warming to 2C is assessed to be between 10 and 16GtCO2e in 2030. Without strengthening, the NDCs risk “lock-in into carbon-intensive infrastructure and increased risk of stranded fossil fuel assets” that would “exacerbate the socio-economic strain of implementing the transition, leading to an increased risk of overshooting the warming and a higher risk of climate change impacts”.
The past few years have seen a proliferation of longer-term pledges by countries to reach net-zero CO2 or GHG emissions in the latter half of the 21st century. Promises from 77 countries now cover at least 76% of global greenhouse gas emissions.
The report suggests that the literature on these commitments is still developing and it is unclear what their aggregate effect would be – presuming that they are all met. A number of studies were released after the WG3 literature cutoff date (the date at which studies had to be published to be included in the report), suggesting these long-term net-zero commitments could limit global temperatures to below 2C by 2100 – though researchers warned these should be discounted until reflected in near-term pledges.
What is needed for 1.5C and 2C targets
The WG3 report assesses a wide range of scenarios associated with 1.5C (C1 and C2) and 2C (C3 and C4) outcomes. The lowest of these scenarios (C1), where warming is limited to 1.5C with no or limited overshoot, has become notably more difficult to achieve since the IPCC special report on 1.5C was published in 2018, due to four years of flat or modestly increasing global emissions. These scenarios are now associated with higher peak warming in most models, leading to a lower likelihood of limiting warming to 1.5C, the WG3 report says.
The report sets out what it would take to keep warming below 1.5C:
“Mitigation pathways limiting warming to 1.5C with no or limited overshoot reach 50% reductions of CO2 in the 2030s, relative to 2019, then reduce emissions further to reach net-zero CO2 emissions in the 2050s.”
In 2C pathways, emissions fall 50% “in the 2040s” and reach net-zero CO2 “by 2070s”.
In both cases, other GHG emissions will have to be reduced significantly, but are difficult to fully get down to zero given the diffuse sources of methane and nitrous oxide emissions.
Net-zero CO2 emissions are expected to lead to relatively flat temperatures, the report says, while net-zero GHG emissions result in declining global temperatures.
In practice, pathways reaching net-zero GHGs tend to balance out residual non-CO2 GHG emissions with net-negative CO2 emissions. Net-zero CO2 emissions are generally reached by models around 10 to 40 years before net-zero GHG emissions, for those scenarios reaching net-zero GHGs in the 21st century.
While most scenarios that limit warming to well-below 2C (C1-C3) employ significant amounts of net-negative emissions, not all do. Scenarios with more immediate emissions reductions tend to have no or low overshoot and limit the amount of late-century CDR needed.
However, even in the most ambitious emission reduction scenarios (C1), most pathways still have a limited amount of overshoot, with the median model in that category having a 2-in-3 risk of overshooting 1.5C at some point in the 21st century.
Both the peak and 2100 temperatures reached in scenarios is related to the year in which peak emissions are achieved, though there is considerable spread, influenced by the emissions trajectory before reaching net-zero and the degree of overshoot and net-negative emissions.
Scenarios with very rapid emissions reductions and limited or no net-negative CO2 emissions can, counterintuitively, allow some small residual positive emissions from hard-to-abate sectors of the economy, and can potentially have a later net-zero CO2 year than scenarios with higher emissions in the short-term.
Pathways that limit warming to 1.5C with no or limited overshoot (C1) reach net-zero CO2 emissions “between 2050-2055” on average, with a range of between 2035 and 2070 across all the scenarios assessed.
C2 scenarios, on average, reach net-zero between 2055 and 2060 with a range from 2045 to 2070, while C3 scenarios reach net-zero “between 2070-2075” with a range of 2055 to 2100 or later. The median net-zero year and range across all the scenarios are shown for each climate category and illustrative pathway limiting warming to below 2C in the Carbon Brief chart below.
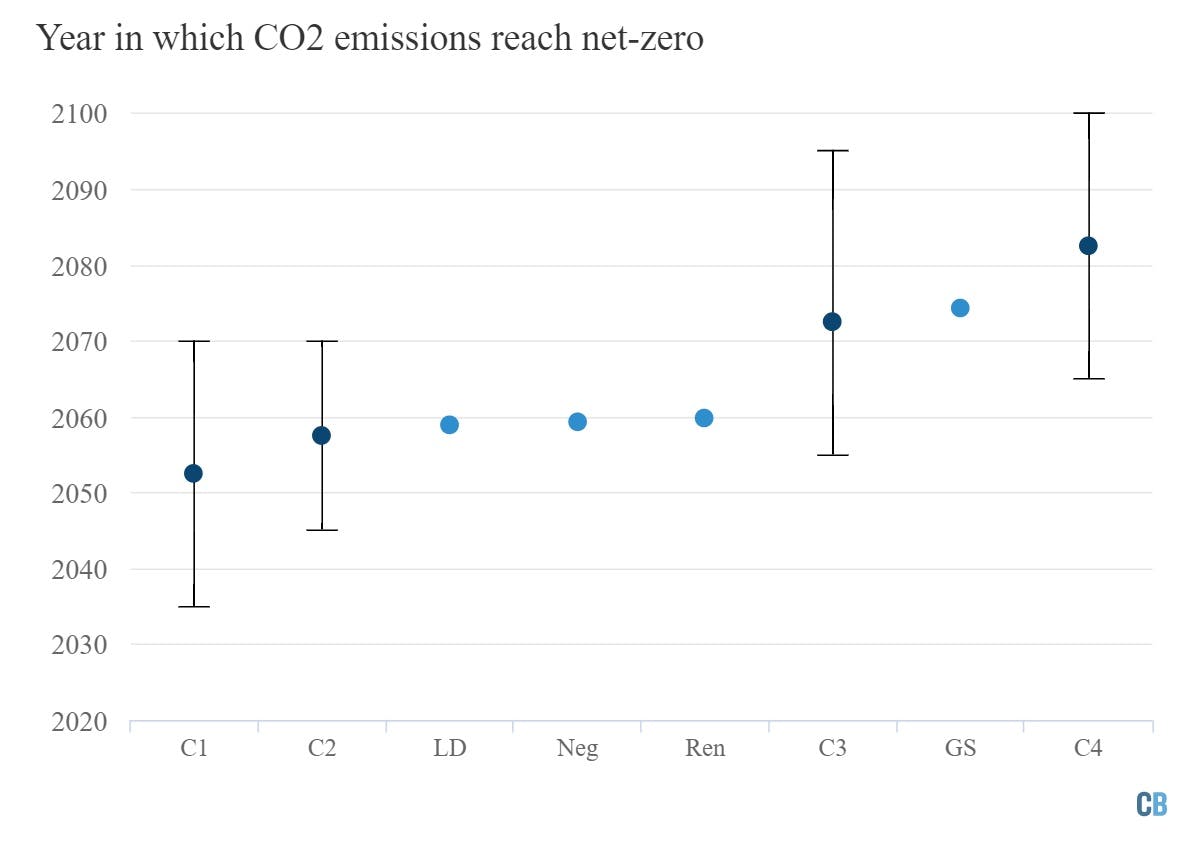
Year in which net-zero CO2 emissions are reached across climate categories (C1-C4) and illustrative pathways (LD, Neg, Ren and GS) that limit warming to below 2C by 2100. Climate categories show the median and range of net-zero years across all scenarios in that category. Chart by Carbon Brief using Highcharts.
The fact that some of these models have a later net-zero emissions date does not imply that emissions reductions can be delayed, or that we “have more time to rapidly reduce current emissions levels compared to SR1.5”.
Rather, the scenarios with the latest peak year are often the ones with largest near-term emissions reductions, as they reserve more of the remaining carbon budget for later years.
When net-zero CO2 emissions are reached, scenarios generally have residual non-CO2 emissions ranging between 4-11GtCO2e.
Methane emissions are reduced by around 20% in 2030 relative to current levels in pathways likely limiting warming to 2C (C3) and by around 33% in 1.5C pathways with no or limited overshoot (C1). Both C1 and C3 pathways reduce methane emissions by around 50% by 2050, with similar reductions of nitrous oxide (N2O).
This demonstrates the difficulty of deep reductions of non-CO2 GHGs and the fact that reductions potentials are largely exhausted when limiting warming to below 2C.
Net-zero GHG emissions – where net-negative CO2 emissions balance out residual non-CO2 GHG emissions – are, on average, reached between 2095 and 2100 in C1 pathways, with close to 50% of C1 pathways and 70% of C3 pathways not reaching net-zero GHG emissions until after 2100.
While technical measures can significantly reduce methane and N2O emissions at relatively low costs to about 50% of the current levels, the report says, further reduction may need to come from broader behavioral changes, such as switching to a less meat-intensive diet.
There are different mitigation strategies that can be employed to limit warming to well-below 2C, as shown by the illustrative pathways. Some have a heavy reliance on renewables (Ren), a strong emphasis on energy demand reductions (LD), wide-spread deployment of CDR (Neg), or focus mitigation in the context of sustainable development (SP).
In some scenarios, a small part of the energy system is still based on fossil fuels in 2100 (Neg), while, in others, fossil fuels are almost or completely phased out (Ren).
However, all mitigation pathways show “greatly reduced” fossil fuel use, with the three that limit warming to 1.5C with no or limited overshoot (Ren, LD, SP) unabated coal use “completely” phased out by 2050. While the GS and Neg scenarios rely heavily on CDR, its use is purposely restricted in the other illustrative pathways focused on deep mitigation (Ren, LD and SP). These mitigation scenarios tend to feature a widespread electrification of the global energy system, as direct combustion of fuels in buildings and vehicles is increasingly replaced with electric alternatives.
The figure below shows the energy use over time by source in the illustrative pathways (top part), as well as the amount of positive GHG emissions and CDR at the net-zero year, compared to 2019 (bottom part).
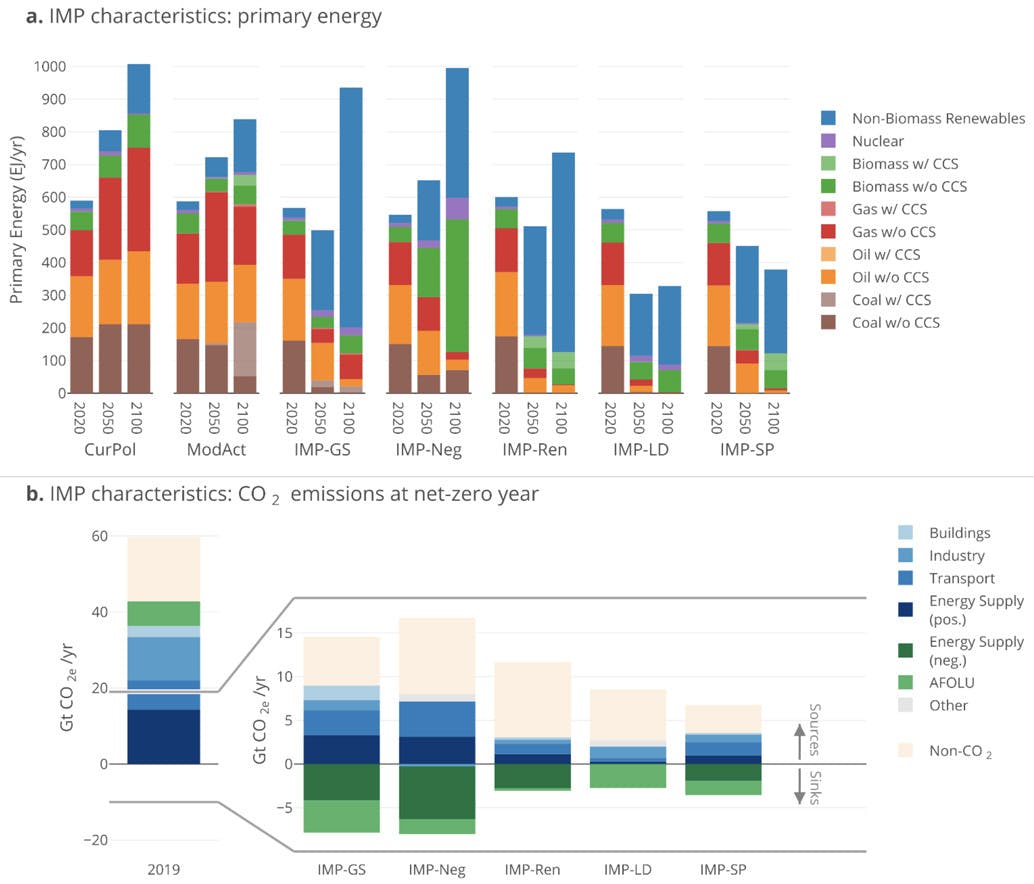
Primary energy mix by source for each illustrative pathway in 2020, 2050, and 2100 (top). GHG emissions and CDR by type at the year in which CO2 emissions reach net-zero (bottom). Source: IPCC (2022) Figure 3.16.
One area where there is a lot of new focus in WG3 compared to previous reports such as the 2018 SR15 is low-demand scenarios. These involve a significant decoupling of material and energy demands from economic growth, resulting in very low per-capita demand for energy compared to present due to increased energy efficiency and less energy intensive lifestyles.
Illustrative pathways taking this approach – LD and SP – have the lowest peak and 2100 warming of all pathways considered, though it is unclear how possible these pathways would be to achieve in practice as they require energy efficiency improvement rates considerably above those previously experienced.
Similarly, the high level of CDR used in pathways such as Neg has large challenges; as the report notes, “CDR ramp-up rates and absolute deployment levels are tightly limited by techno-economic, social, political, institutional and sustainability constraints”.
The challenges around feasibility of the assumptions in different illustrative pathways are shown in the figure below. Here both the level of biomass deployment in the Neg scenario and the level of institutional challenges in all scenarios (but particularly LD, SP, and Ren) are considered to be “unprecedented”.
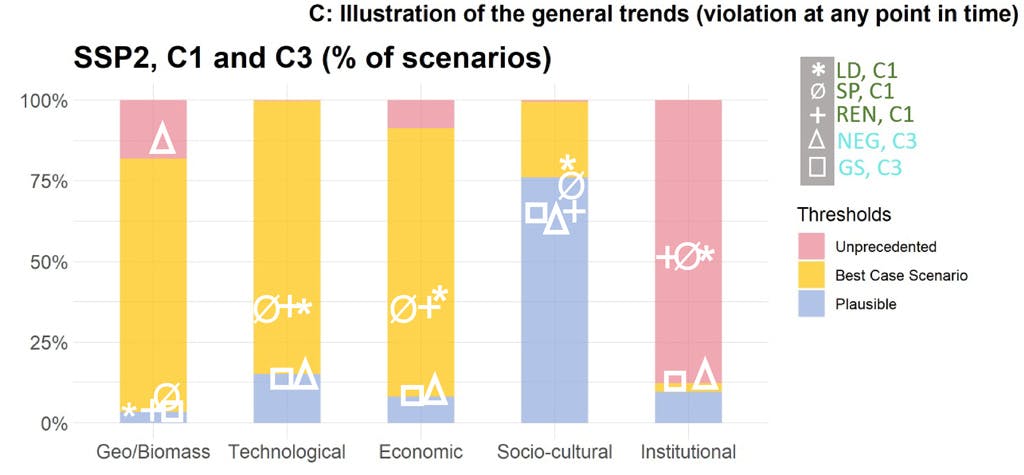
Feasibility characteristics of C1 and C3 scenarios, with the location of illustrated pathway scenarios highlighted. Source: IPCC (2022) Figure 3.43c.
WG3 also briefly discusses “degrowth” scenarios – where economic growth is reduced to zero or even declines in developed countries to reduce emissions.
These are not directly featured in WG3, whose scenarios are “more commonly based on the idea that decarbonisation can be combined with economic growth by a combination of technology, lifestyle and structural economic changes”, but the report notes that they “could result in a dramatic reduction of energy and resource consumption”.
The role of carbon dioxide removal
The report affirms that reducing global CO2 emissions to zero will stop global warming. However, for global temperatures to be reduced in the future net negative CO2 emissions are needed – particularly once non-CO2 GHG emissions have been cut as much as possible.
This means that to reduce future temperatures, CO2 will have to be actively removed from the atmosphere through human activity.
As the report notes, CDR “is a necessary element of mitigation portfolios to achieve net-zero CO2 and GHG emissions both globally and nationally, counterbalancing residual emissions from ‘hard-to-transition’ sectors such as industry, transport and agriculture”. It is “a key element in scenarios likely to limit warming to 2C or lower, regardless of whether global emissions reach near-zero, net-zero or net-negative levels”.
At the same time, the report cautions that the role of CO2 removal can at times be “inflate[d]” in model pathways because of “insufficient representation of variable renewables”, such as wind and solar, limited use of demand-side options and high discount rates.
CDR can come in a number of different forms, including afforestation/reforestation, bioenergy with carbon capture and storage (BECCS), direct air capture with carbon storage (DACCS), enhanced weathering, biochar, wetland restoration, soil carbon, bio-CO2 use in industrial processes and ocean alkalinity enhancement.
Most scenarios employing CDR in WG3 primarily focus on afforestation/reforestation and BECCS, though some models include the deployment of DACCS, which was largely absent in previous generations of models. (Note that this largely reflects modelling choices rather than the feasibility or preferability of these or alternative approaches to CDR.)
CDR is used to some extent in nearly all scenarios that limit warming to below 2C (C1-C4), with more deployed the lower the target temperature, the slower the near-term emissions reductions, and the higher the mid-century temperature overshoot.
CDR is used by models to accelerate the pace of emissions reductions, counterbalance residual emissions from hard-to-decarbonise sectors, such as industry, transport and agriculture, and to deal with overshoot in the long-term – particularly in 1.5C scenarios.
However, the WG3 authors caution that CDR “cannot serve as a substitute for deep emissions reductions”. The amount of CDR deployed in pathways assessed by WG3 is generally less than 25 years of current emissions (~1,000GtCO2), with most models deploying closer to half of that.
There are no scenarios where large deployments of CDR avoid the need to substantially reduce emissions over the course of the 21st century, if warming is to be limited below 2C. WG3 emphasises that “the emission reduction via more conventional mitigation measures (efficiency improvement, decarbonisation of energy supply) is much larger than the CDR contribution”.
WG3 also highlights concerns that “the prospect of large-scale CDR could…obstruct near-term emission reduction efforts, mask insufficient policy interventions, might lead to an overreliance on technologies that are still in their infancy, could overburden future generations, might evoke new conflicts over equitable burden-sharing, [and] could impact food security, biodiversity or land rights”.
Since the publication of the SR15 report in 2018, a sizable number of scenarios have explored pathways where CDR is minimised, overshoot is avoided, and net-negative CO2 emissions are not relied upon. As an alternative, many of these scenarios prioritise behavior change and energy demand reductions that can “significantly reduce” the need for CDR.
These scenarios were developed due in part to scepticism around the reliance of models on BECCS. The report notes that “there has been fervent debate on the large-scale deployment of [BECCS] in scenarios. Hence, many recent studies explore mitigation pathways with limited BECCS deployment.” It also highlights that most CDR technologies “have not been tested at large scale” and will “require more R&D” in the years ahead.
The newly developed scenarios that deliberately attempt to limit the use of CDR have had the effect of moderately reducing the amount present in the median scenario, compared to those in the SR15. As the report explains, “given the larger contribution of scenarios in the literature that aim to reduce net-negative emissions, emission reductions are somewhat larger in the short-term compared to similar categories in the IPCC SR1.5”.
This illustrates one of the pitfalls of focusing on median scenarios, given that they may be skewed by the choices of modellers over which pathways to investigate and what assumptions to include, rather than reflecting useful information about how best to reach a given target.
If anything, the four years of high global emissions since the SR15 was published make it more difficult to limit warming to 1.5C while minimising CDR, compared to a world where emissions had declined after 2018.
The Carbon Brief figure below shows the amount of CDR from BECCS and DACCS in the median scenario in both the AR6 WG3 and the SR15. CDR from afforestation/reforestation is not shown, due to challenges in the consistency of reporting by models participating in the WG3 process. The full range of values across scenarios can be found in Table 3.5 in the report.
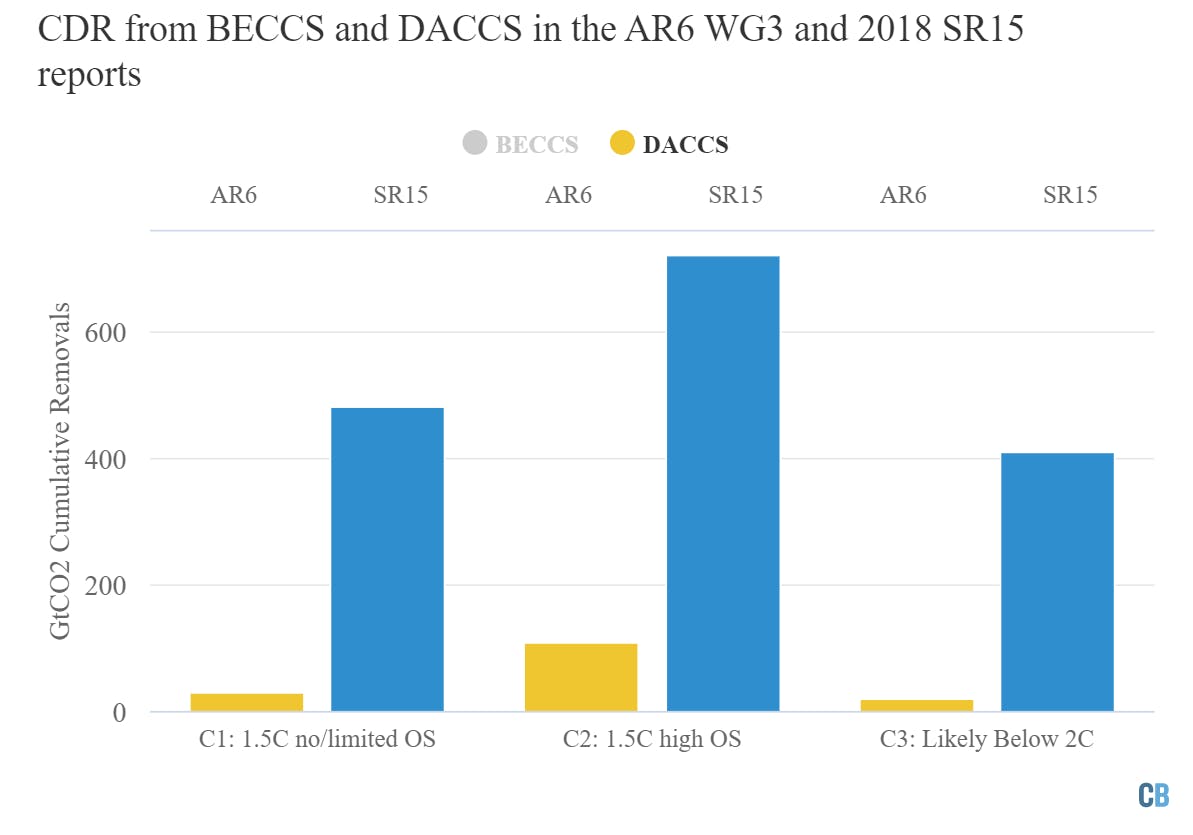
Cumulative deployment of BECCS and DACCS between 2020 and 2100 in the median scenario in the WG3 and SR15 reports for C1-C3 scenarios (and their SR15 equivalents). Chart by Carbon Brief using Highcharts.
The combination of BECCS and DACCS deployments is between 20% and 25% lower in WG3 compared to the SR15, largely due to the availability of scenarios that purposefully limit the deployment of CDR through more rapid near-term mitigation in WG3.
Scenarios designed to limit CDR still deploy it to offset residual positive emissions, even if they may not rely on significant amounts of net-negative emissions.
The median amount of DACCS is relatively low in the WG3, in part because many models (such as AIM, IMAGE, GCAM, and MESSAGE) still do not include DACCS. The portion of models deploying different types of CDR approaches is shown in the figure below. Note that while nearly all scenarios also employ afforestation/reforestation and other land-use (AFOLU) CDR, it is difficult to precisely estimate how much is being used due to differences in data reporting across models. As the report notes, “Cumulative CDR from AFOLU cannot be quantified precisely because models use different reporting methodologies that in some cases combine gross emissions and removals, and use different baselines.”
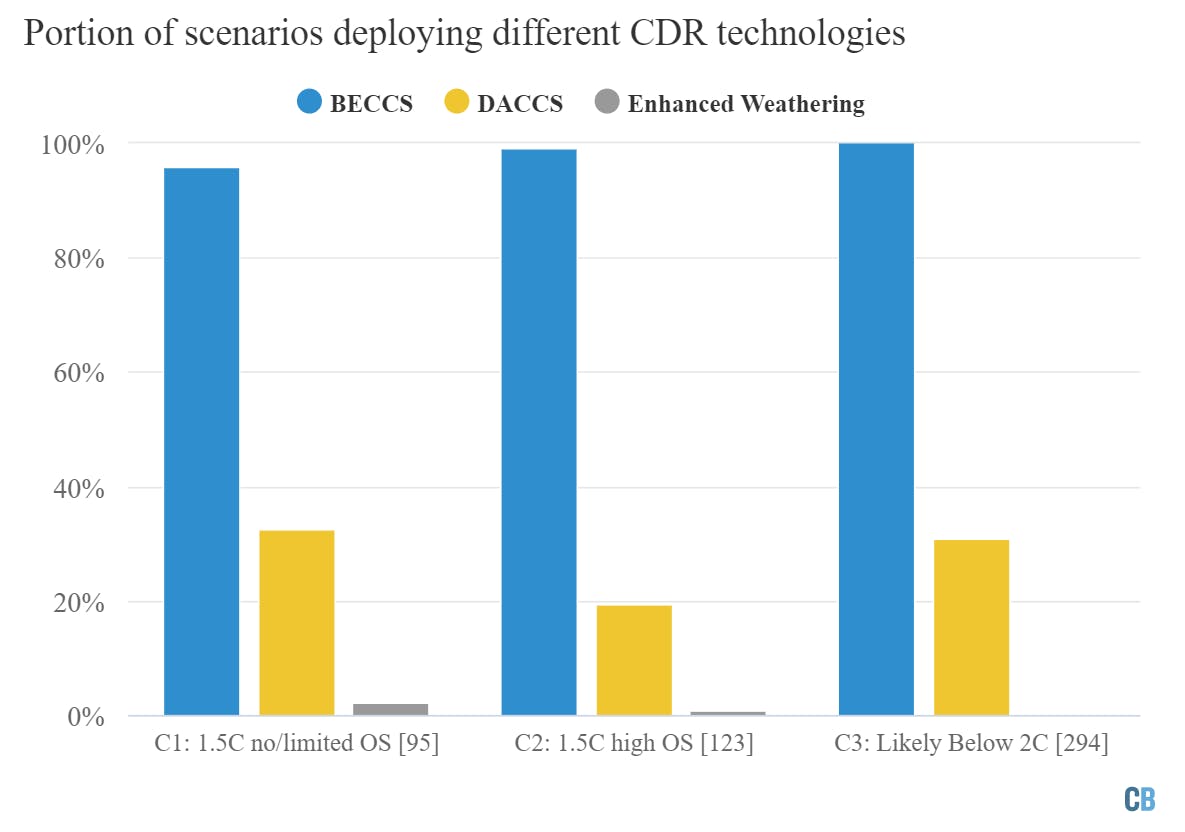
Percentage of scenarios deploying different types of CDR technology in C1-C3 climate categories. Scenarios which may be able to simulate a CDR technology but do not deploy it are not counted toward the portion deploying. Brackets show the number of scenarios in each climate category. Chart by Carbon Brief using Highcharts.
This illustrates another common pitfall in interpreting model data; when looking at the median model (rather than the full range of model outcomes), users may get a mistaken impression of choices by models in terms of what technologies to deploy when not all technologies are supported by all models.
Different CDR technologies have different implications for the duration of CO2 removal. For example, CDR through afforestation/reforestation and other nature-based climate solutions can be maintained for decades, but not over the very long term, as the ability of the system to take up additional CO2 will ultimately decrease.
This puts a limit on the amount of CDR available from nature-based solutions and results in the deployment of other approaches in scenarios where larger amounts of CDR is needed. There are also challenges around permanence surrounding nature-based solutions. Nature-based solutions “do not continue to sequester carbon indefinitely”, and a warming world is expected to put increased stress on ecosystems through things such as wildfires and expanded habitat for pests, putting “accumulated carbon…at risk of future loss due to disturbances”.
By contrast, approaches such as BECCS and DACCS result in more permanent carbon removal, but lack the ecosystem co-benefits and come with their own challenges around land and energy use.
BECCS involves extensive land use and can potentially result in emissions that offset some of its benefits, if food production is displaced to other regions and carbon storage opportunities are foregone – if the land used for BECCS could have been used for reforestation instead.
These dynamics – which often result in BECCS projects having “early-on positive CO2 emissions and net-negative effects are only achieved in time” and having a “carbon debt” – are not represented in most IAMs, the report explains.
DACCS, by contrast, requires relatively small land use, but involves a large amount of energy use, the report says. Removing 10GtCO2 per year via DACCS – a value comparable to the total CDR deployment in many models in the latter half of the 21st century – would require an amount of energy equivalent to 7% to 17% of current global demand using existing technologies. The effectiveness of DACCS also depends on the type of energy used to operate it – and any emissions associated with producing that energy.
The amount of CDR deployed by models tends to increase with 2030 emissions levels. In a world where NDCs are not substantially strengthened, the amount of CDR deployment in the second half of the 21st century would be 50% to 100% higher to limit warming to 1.5C, according to the report.
Each 0.1C of temperature overshoot above 1.5C will require the deployment of around 220 GtCO2 (~5.5 years of current global emissions) additional CDR to bring temperatures back down after net-zero CO2 emissions are reached.
This story was published with permission from Carbon Brief.


