
Our two favourite topics, data visualisation and climate science, recently met on summer solstice for the “Show Your Stripes” campaign which aims to raise awareness on global warming.
The initiative, supported by scientists around the globe, was launched by Ed Hawkins, a University of Reading professor, with the mission to “communicate climate change in a simple, stark and compelling way as possible”.
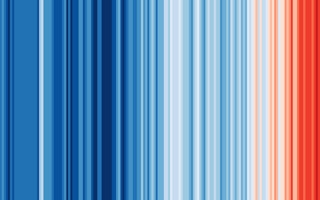
Does the Tate Modern-worthy visualisation look familiar to you? That’s because the simple yet powerful message of this graphic even managed to convince The Economist to dedicate its cover page to the initiative two years ago.
So what does it actually show us? The picture is a horizontal timeline from the early 20th century up until today, whereby each stripe represents a year’s worth of temperature change.
The blue indicates cooler-than-average years, while the shades of red indicate hotter-than-average years. The primary conclusion drawn from the data is the unquestionable average annual rise in temperatures globally.
What does the data tell us?
Evidence of the contribution of industrial activities to the global abnormal temperature rise is growing. Therefore, we look towards relevant data that could possibly give us insight into whether or not corporate reorientation is actually taking place.
Arabesque S-Ray’s Temperature Score metric allows us to do just that in assessing how much companies are contributing to the global climate crisis according to their current GHG emissions. S-Ray’s research team assessed the constituents of 14 major global stock indices to conclude whether or not they are on track to achieve the 2050 carbon reduction goals set out in the Paris Agreement.
Pole position was taken by the Stockholm 30, with over 50 per cent of companies on target for within a 1.5°C temperature increase. Both the S&P 100 and FTSE 100 position themselves in the middle, with only 23 per cent of index companies on track to meet the targets.
The index with the most “room for improvement” is Australia’s ASX 50, of which a mere 4.5 per cent of companies are in line with the Paris agreement’s climate targets. Averaging out the aforementioned data, less than 25 per cent of companies within these major indices are expected to contribute to a temperature rise of equal or less than 1.5°C.
What can we do?
Is our house on fire? Well, if everything continues as it is, it may soon be! We encourage you to explore the Show Your Stripes website which enables you to analyse temperature change trends across various regions.
From an investment perspective, most of us find ourselves at the crossroad – do we divest to “force” non-compliant companies to rethink, or do we still invest in non-compliant companies to bring about change through engagement?
At Arabesque Asset Management, we place a large emphasis on transition and have consequently initiated a campaign that aims to encourage the companies we invest in to enhance their emission reporting and improve on their environmental metrics.