The main scenario in the company’s latest annual “Energy Outlook”, released yesterday, shows renewables rising four-fold to 2,000 million tonnes of oil equivalent (Mtoe) by 2035. This is an upwards revision of around 400Mtoe compared to last year’s main forecast.
The projections also show, for the first time, global oil demand peaking by 2040. Oil remains the world’s largest fuel source, however.
This 2018 edition of BP’s outlook also projects coal will peak before 2030, an even earlier projection than it gave last year.
Oil peak
BP’s report focuses on its new “evolving transition” scenario, which replaces its “base case” scenario from previous years (see more on this below). However, it no longer says this is the “most likely” future scenario.
In this new projection, rising energy demand over the next 20 years is driven by fast-growing developing economies, with China and India accounting for half of the growth.
As the graph below shows, it projects a peak for both coal and oil in the coming decades, but continually rising demand for gas.
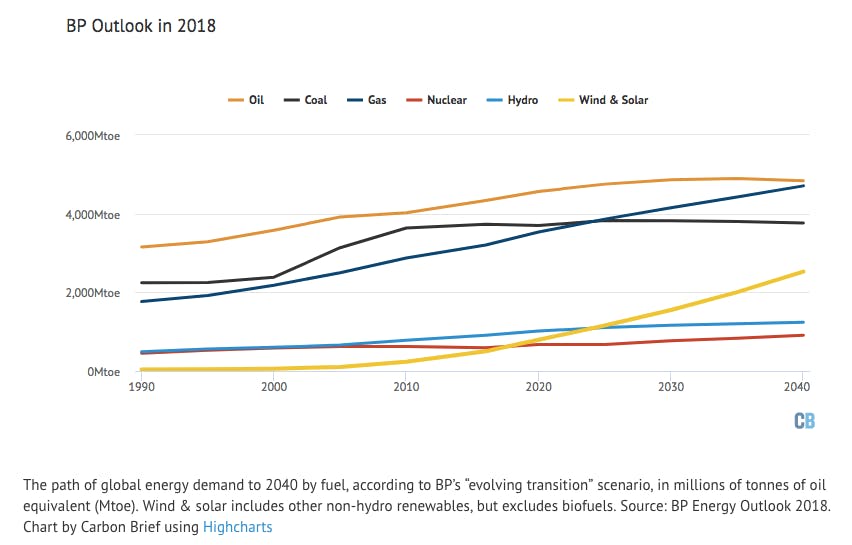
Oil consumption peaks for the first time at some point between 2035 and 2040. However, even in 2040, it will sit at around 4,800Mtoe, more than 50 per cent higher than in 1990.
This is driven in part by falling demand from transport due to vehicle efficiency improvements and alternative fuels, says BP. By 2040, 40 per cent of new cars sold are electric vehicles (EVs) in the evolving transition scenario, while 31 per cent of kilometres travelled by car are in EVs. The scenario expects energy use in transport to plateau around 2035-40.
Oil use in transport stops growing towards 2030. Non-combusted uses of oil – such as feedstocks for petrochemicals – become the main source of growth demand after 2030. However, oil demand still accounts for around 85 per cent of total transport fuel demand in 2040.
Some have noted that BP’s Outlook has less to say on forms of transport other than cars, with little on aviation, shipping and trucks despite these sectors accounting for the biggest slice of oil demand growth for the industry.
The projection also shows a rising gas demand steadily closing in on oil. In 2040, 26 per cent of primary energy comes from gas in the scenario, compared to 27 per cent from oil.
Meanwhile, as the graph shows, the scenario showscoal peaking between 2025 and 2030, hovering at around 3,800 Mtoe by 2040.
This decline is driven by falling coal use in China, where the BP report says it seems increasingly likely coal consumption has peaked already.
The outlook shows China’s carbon emissions from energy use peaking in the mid-2020s. Renewables, nuclear and hydro account for more than 80 per cent of the increase in China’s energy demand by 2040, with renewables overtaking oil to become the country’s second largest energy source.
However, the scenario show coal remaining the dominant energy source for power in the rest of Asia, accounting for 45 per cent of India’s sizeable increase energy demand.
Renewables win
Renewable energy is the fastest-growing energy source in the main scenario, accounting for 40 per cent of the energy increase in 2040.
Demand for wind and solar reaches around 2,000Mtoe in 2035, quadrupling from the 500Mtoe used in 2015. A further 500Mtoe is added by 2040. By this time wind and solar will meet around 14 per cent of the world’s primary energy consumption.
Carbon Brief’s chart below shows how BP’s projections for 2035 compare since 2011.
The revision is particularly striking this year for wind and solar. As the chart shows, the projection for 2035 has risen significantly compared to the base case scenario last year. BP now expects around 400Mtoe higher demand of wind and solar by 2035 than the 1,600Mtoe forecast in the 2017 report.
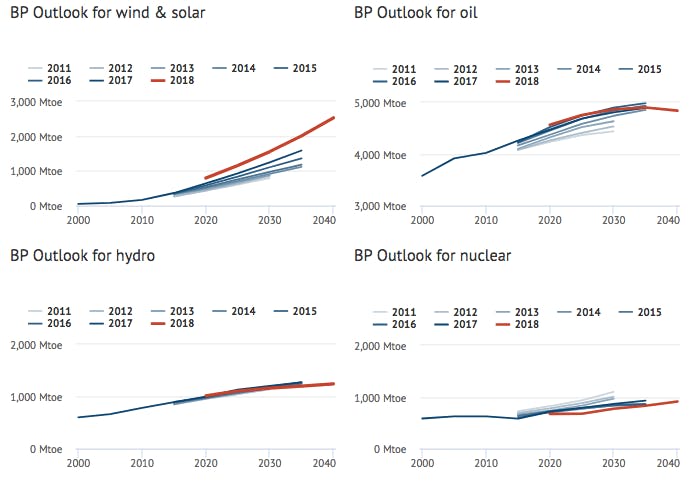
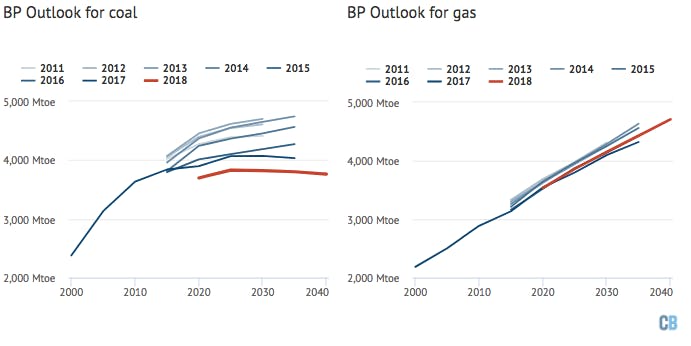
Meanwhile, the charts show that BP has lowered its outlook for hydro and nuclear.
As the charts above show, the new projection shows coal peaking before 2030, earlier than in the “base case” scenario last year which foresaw the peak occurring before 2035. This year’s outlook shows coal accounting for 21 per cent of primary energy demand by 2040, down from 28 per cent in 2016.
China accounts for almost 90 per cent of the total growth in nuclear up to 2040, BP’s report says, with its share in China’s energy demand increasing from 2 per cent today to 8 per cent by 2040. Butdeclines are seen in both the EU and US as aging nuclear plants are retired and not replaced.
Not predictions
It is worth a cursory note to emphasise that none of the scenarios in the energy outlook are predictions. Instead, they are modelled scenarios based on a range of different inputs. As BP puts it:
“These scenarios are not predictions of what is likely to happen or what BP would like to happen. Rather, they explore the possible implications of different judgements and assumptions by considering a series of “what if” experiments.”
As Carbon Brief’s comparisons of earlier outlooks shows, BP has repeatedly underestimated the rise of renewables, as well as overestimating the demand for coal.
For example, as the chart below shows, the 2014 Energy Outlook put wind and solar demand at around 1,100Mtoe in 2035; by the 2017 Energy Outlook this had been revised up to 1,600Mtoe in 2035.
This year’s outlook, the seventh report in a row to raise projections for wind and solar energy, puts it at around 2,000Mtoe.
The chart below shows how BP’s outlook for 2035 has shifted with each report since 2014, the first year which gave a forecast for 2035.
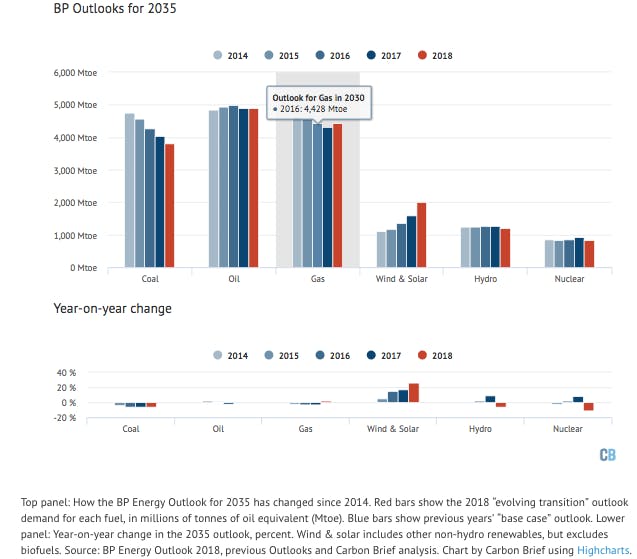
Most significant are the steady steps down for the coal projections and upward steps for the wind and solar projections. Meanwhile, BP’s outlook for oil, nuclear and hydro has remained broadly consistent over the past five years.
Six outlooks
It appears BP may have taken stock of this. In previous years, BP’s report focussed on its “base case”, which the firm said was the “most likely” future scenario, shown in blue in the chart above.
This year, BP has scrapped this “base case” and instead uses what it calls the “evolving transition” scenario as its reference scenario (red in the chart above). The new report stresses that this “does not imply that the probability of this scenario is higher than the others”.
The evolving transition scenario assumes that government policies, technology and social preferences continue to evolve “in a manner and speed seen over the recent past”. World GDP more than doubles by 2040, driven by increasing prosperity in fast-growing emerging economies.
This remains one of its highest emission scenarios, with carbon emissions increasing over 10 per cent by 2040. BP notes that carbon emissions in this scenario are not consistent with achieving the Paris Agreement goals. This highlights “the need for a more decisive break from the past”, it says.
The CO2 emissions resulting from BP’s evolving transition scenario are shown in the graph below in orange. Note that projections go up to 2040 for the first time, rather than 2035 as in recent years.
The chart also shows five alternative global scenarios referenced by BP in its 2018 outlook. The first two of these were also given in last year’s report.
They are:
- Faster transition (light blue), where global emissions fall 25 per cent below 2016 levels by 2040, driven by lower oil, coal and gas demand, and more nuclear and renewables.
- Even faster transition (yellow), where global emissions fall 45 per cent below 2016 levels by 2040, driven by even lower oil, coal and gas demand and a big rise in renewables. This recognises the far bigger change needed than the evolving transition scenario to meet climate goals. It is based on a sharp increase in the carbon price, policies to push energy efficiency and greater fuel switching, and higher use of Carbon Capture and Storage (CCS).
- Internal combustion engine ban (black), where electric car sales become 100 per cent total car sales by 2040. Leading to almost 70 per cent of vehicle travel to be powered by electricity.
- Less coal-to-gas switching (dark blue), where growth in natural gas is slower due to weaker policies promoting the switch from coal.
- Renewables push (red), where more support for renewables means they account for over 90 per cent of power growth up to 2040, rather than 50 per cent in the evolving transition scenario.
Note: In this article, Carbon Brief has rounded BP’s projections to the nearest 100Mtoe. See the graphs for more precise numbers.
This story was published with permission from Carbon Brief.


