The research, published in Nature Ecology & Evolution, uses satellite data to identify the 500 most extreme wildfires in recent years. Almost a third of these megafires caused deaths, burned down homes, or were declared a disaster by a national government.
Using climate change projections for the middle of this century, the study suggests there will be a 35 per cent increase in the days with high danger of fire across the world.
But some regions will see even larger increases, the researchers say, including western states of the US, southeastern Australia, the Mediterranean and southern Africa.
Black Tuesday
On the 7th February 1967, dozens of bushfires tore through Hobart, the capital of Tasmania. In the space of four of five hours, the ferocious wildfires killed 62 people, injured 900 and destroyed 1,400 homes.
Black Tuesday, as the disaster came to be known, remains one of the worst wildfires in Tasmania’s – and Australia’s – history.
“
More extreme fires are predicted along the Australian east coast including Brisbane, and the whole of the Mediterranean – Portugal, Spain, France, Greece, and Turkey.
David Bowman, study lead author
Today is the 50th anniversary of Black Tuesday, and residents of Tasmania will be marking the occasion with an exhibition of objects that people saved from the fires and the stories that go with them.
It’s exactly these types of extreme wildfires that the new study investigates. The research, led by scientists from the University of Tasmania in Hobart, uncovers where megafires are most likely to strike around the world, and how they might be affected by climate change.
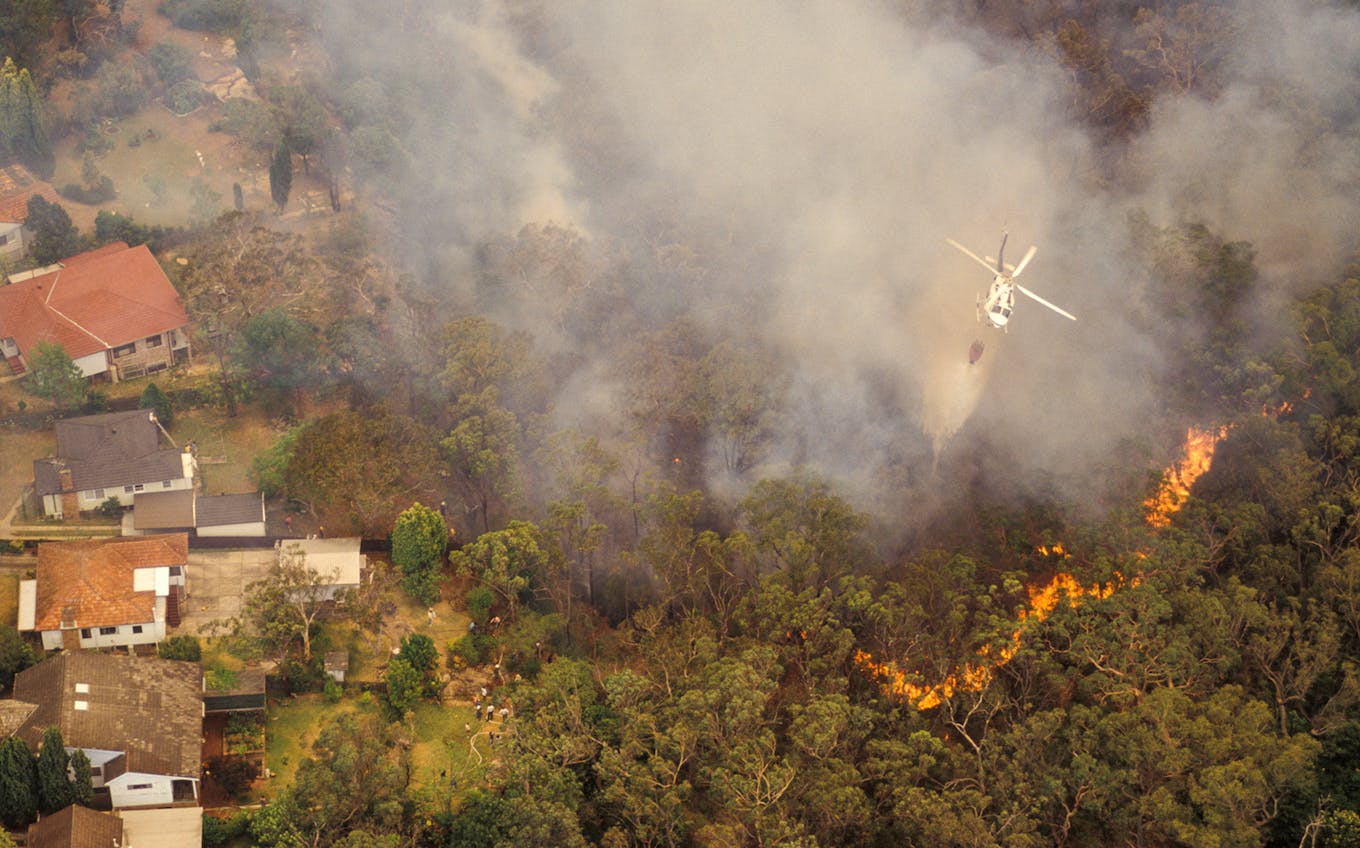
Aerial view of water bombing a bushfire from a helicopter, Sydney, Australia. Image: John Carnemolla/iStock/Getty Images via Carbon Brief.
‘Game changer’
The study uses satellite data collected by imaging instruments aboard two NASA satellites, Terra and Aqua. The Moderate Resolution Imaging Spectrometer, or “MODIS”, was a “game changer” for scientists measuring wildfires, says Prof Louis Giglio, a research professor at the University of Maryland, who wasn’t involved in the study.
“Through the 1990s we were stuck using sensors that were never intended for observing fires, and consequently provided a distorted view of global fire patterns and behaviour. MODIS…enabled us to begin mapping biomass burning worldwide with unprecedented fidelity and consistency.”
Using MODIS data, the researchers identified more than 23 million wildfires globally between 2002 and 2013.
While the most severe fires are often loosely dubbed “megafires”, the researchers went a step further by identifying the 500 most extreme wildfires to carry forward for their analysis.
Of these 500, 22 were ruled out as they were caused by volcanic eruptions or industrial fires. With the remaining 478, the researchers assessed which ones could be classed as “disasters”.
There are many definitions of wildfire disasters, the researchers note, many of which focus on the economic impacts – but there is no consistent global database for this.
So the researchers based their definition on whether an emergency was declared or the fires caused death or loss of property. For this they used national disaster databases, news reports and internet searches.
In the map below, you can see the 144 “disastrous” megafires as red triangles. The blue dots are the other 338 fires that didn’t cause economic or social harm. The grey shading indicates areas that have experienced the most wildfires – of any severity – over 2002 to 2013.
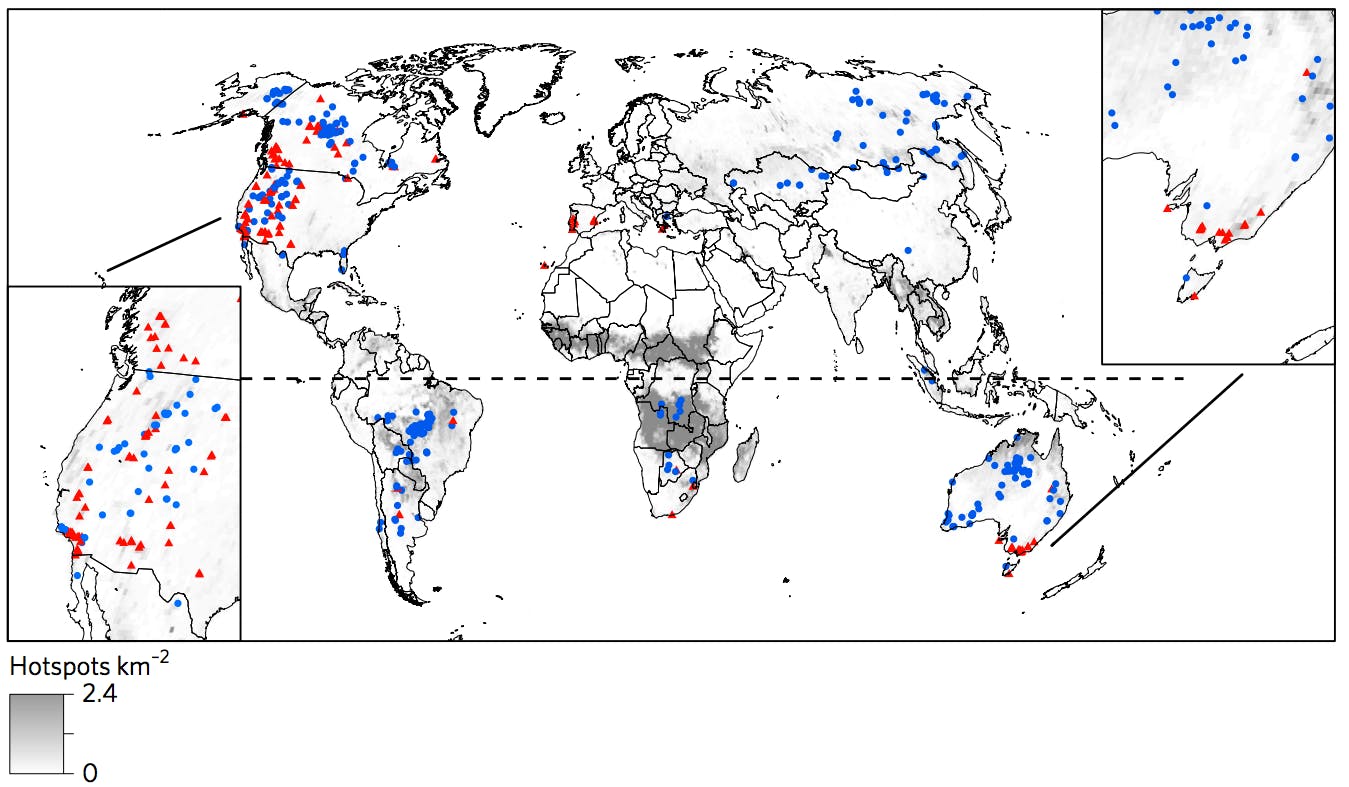
Global distribution of 478 “extreme wildfire” events, classified by those identified as being disasters (red triangles) or not (blue dots). Grey shading indicates the frequency of wildfires (of any size) between 2002 and 2013. Source: Bowman et al. (2017)
The map shows that megafires hit all continents (except Antarctica), though are predominantly found in subtropical and temperate regions.
Arid areas, such as North Africa and the Middle East, tend not to see megafires as there is limited vegetation to burn. In the savannahs of tropical Africa, meanwhile, frequent wildfires mean vegetation doesn’t often build up sufficiently to allow a fire to turn into a megafire.
The “disastrous” megafires are mostly concentrated in two main areas, explains lead author Prof David Bowman. He tells Carbon Brief:
“We found that economically and socially disastrous extreme fires were concentrated in regions where humans have built into flammable landscapes, such as areas surrounding cities in southern Australia and western north America.”
Nearly all – 96 per cent – of these disastrous megafires occurred during periods of unusually hot and/or dry weather, the researchers say.
Making ‘a bad situation worse’
Recent research shows that the number of days wildfires are likely to burn each year is increasing as global temperatures rise. And the new study finds that extreme wildfires are likely to become more widespread in future, Bowman says:
“Climate change projections suggest that the geographic footprint of dangerous fire weather is likely to expand globally.”
The study projects how the Fire Weather Index (FWI) – an estimate of wildfire risk based on weather conditions and how dry the landscape is – will change across the world in future. They look specifically at the changes in “high” fire danger under a climate change scenario where global CO2 emissions aren’t curbed (RCP8.5).
You can see the results in the map below, which shows the projected change in “high” fire danger from 2000-14 to the middle of the century (2014-70). The regions with the largest increase are shaded orange and red, while the areas with decreasing risk are shown in green.
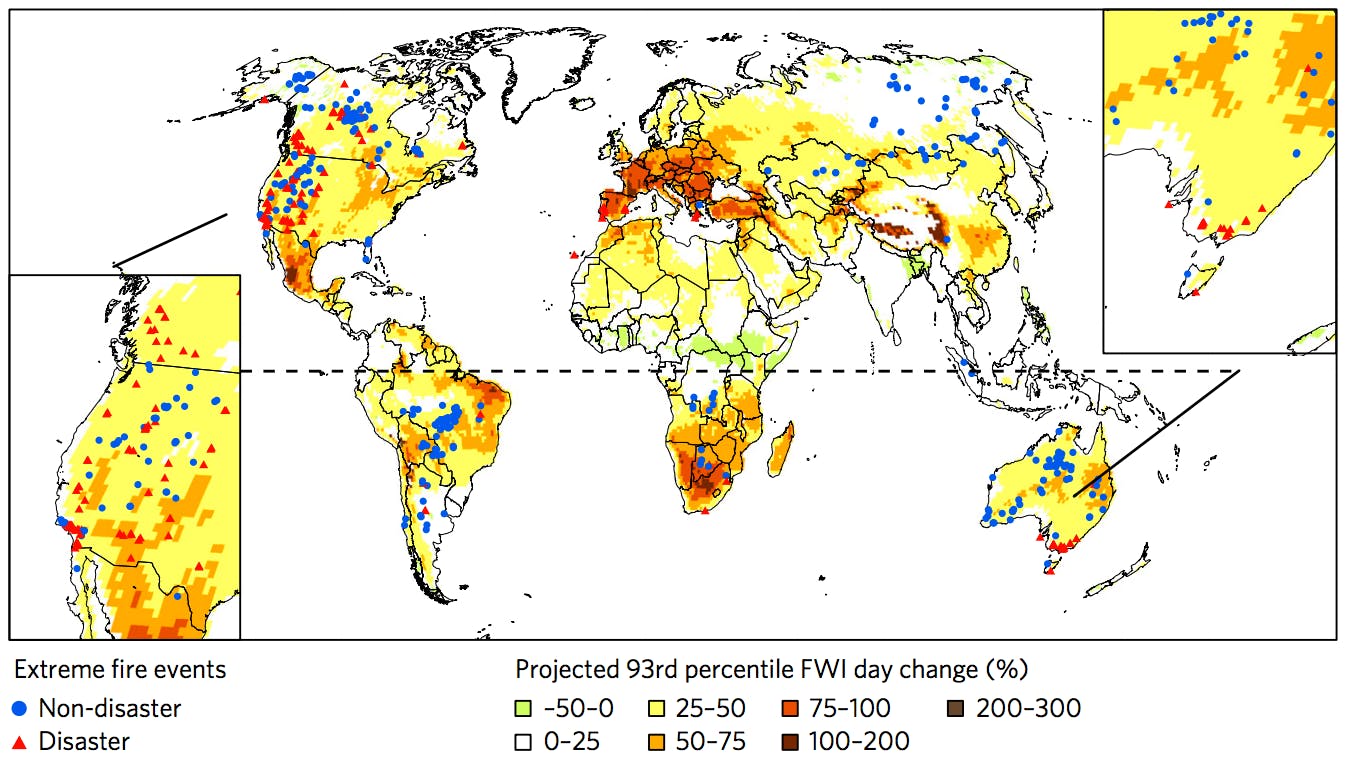
Projected changes in the number of days exceeding the 93rd percentile of the Fire Weather Index (FWI) by the mid 21st century (2041-2070) under a high emissions scenario (RCP8.5). Dark red shading indicates the largest increases, while the pale green hows small decreases. Red triangles and blue dots show recent extreme wildfire events as per previous figure. Source: Bowman et al. (2017)
Globally, the results suggest a 35 per cent increase in the number of days per year with a high fire risk. However, some of the regional increases are much larger, Bowman says:
“More extreme fires are predicted along the Australian east coast including Brisbane, and the whole of the Mediterranean – Portugal, Spain, France, Greece, and Turkey.”
As many towns and cities are in areas where megafires occur – such as in western US and Southern Australia – this will put more people in harm’s way in the future, says Bowman:
“Climate change is going to make a bad situation worse.”
The findings make a compelling case that adds to the mounting evidence on the increasing risk of wildfires, adds Giglio:
“Clearly on the current path we can expect a greater risk of extreme fires in much of the world. The outlook for the western United States is particularly worrying.”
While the publication of this study on the anniversary of Black Tuesday is a “fortuitous coincidence”, says Bowman, it highlights that the combination of cities surrounded by flammable forests and increasing wildfire risk “will lead to more fire disasters”.
This story was published with permission from Carbon Brief.