
Emissions from fossil fuel and industry (FF&I) are expected to reach 36.81bn tonnes of CO2 (GtCO2) in 2019, up by only 0.24GtCO2 (0.6 per cent) from 2018 levels, according to the latest estimates from the Global Carbon Project (GCP).
The data is being published in Earth System Science Data Discussions, Environmental Research Letters and Nature Climate Change to coincide with the UN’s COP25 climate summit in Madrid, Spain.
The growth of global emissions in 2019 was almost entirely due to China, which increased its CO2 output by 0.26GtCO2. The rest of the world actually reduced its emissions by -0.02GtCO2, thanks to falling coal use in the US and Europe, as well as much more modest increases in India and the rest of the world, compared to previous years.
The GCP researchers say that “a further rise in emissions in 2020 is likely” as global consumption of natural gas is “surging”, oil use continues to increase and, overall, energy demand rises.
Despite the rapid rise and falling costs of renewables in many parts of the world, the majority of increases in energy demand continue to be met by fossil fuels. For example, gas met around two-fifths of the increase in demand in 2018, against just a quarter coming from renewables.
Overall, human-caused CO2 emissions, including those from FF&I and land use, are projected to increase by 1.3 per cent in 2019. This is driven by a 0.29GtCO2 (5 per cent) increase in land-use emissions – including deforestation – which is the fastest rate in five years. While land use only represents around 14 per cent of total 2019 emissions, it will contribute more than half the increase in emissions in 2019.
While more modest than in recent years, the increase in emissions in 2019 puts the world even further away from meeting its climate change goals under the Paris Agreement.
Modest increase in emissions
The GCP is a group of international researchers who assess the world’s sources and sinks of CO2. It has published an annual global carbon budget report since 2006.
Its newly released global carbon budget for 2019 provides estimates of CO2 emissions from FF&I in each country, as well as global emissions from changes in land use. It also estimates how CO2 has accumulated in the atmosphere and how much was absorbed by the land and oceans.
The figure below shows global CO2 emissions from fossil fuels, divided into emissions from China (red shading), India (yellow), the US (bright blue), EU (dark blue) and the remainder of the world (grey). Emissions are expected to rise to a new high of 36.81GtCO2 (±1.8) in 2019, with China and the US as the two largest emitters.
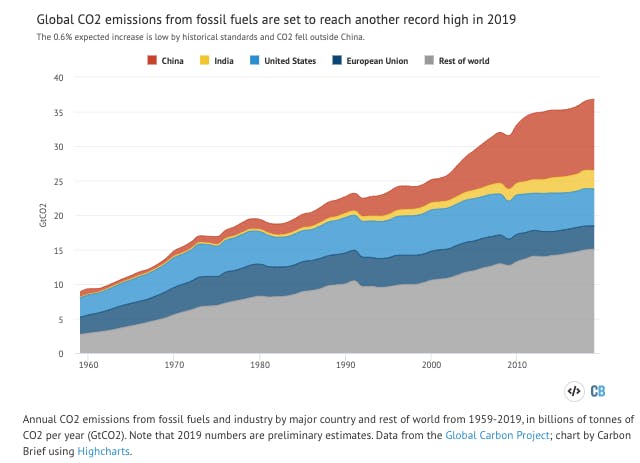
After a rapid increase in global FF&I emissions of around 3 per cent per year between 2000 and 2012, emissions only grew by around 0.4 per cent per year between 2013 and 2016. This led to some overconfident predictions that global CO2 emissions might have peaked, before 2017 saw a 1.1 per cent increase and a much larger 2.2 per cent rise followed in 2018.
While 2019’s expected 0.6 per cent growth is low by historical standards, it is also clear that there is little evidence from the data that peak emissions are likely to occur in the near future. The GCP team suggests that “peak CO2 emissions could remain decades away” given likely continued growth of emissions from oil and gas.
Although overall emissions continue to increase, the global average per capita has been flat for the past 8 years. The figure below shows global average emissions per-capita for each year from 1959 through 2019.
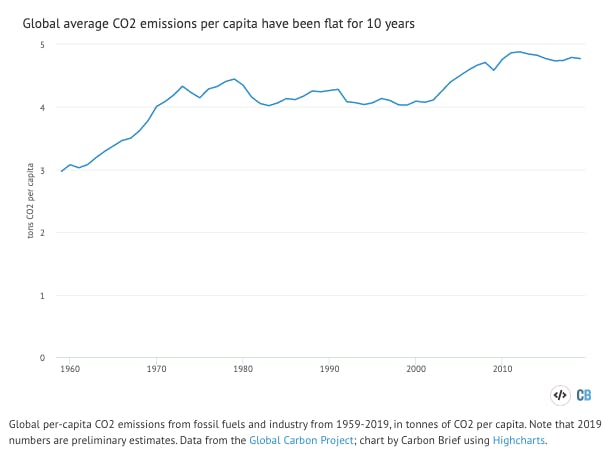
Per-capita emissions fell slightly in 2019 and are now down to 2010 levels. However, these global per-capita values disguise large differences within and between countries. Population growth is generally not occurring as quickly in countries with higher emissions.
Large declines in US and slow growth in rest of world
China was the driver of most of the rise in global emissions in 2019, with an increase of 0.26GtCO2 compared to 2018. Meanwhile, US emissions declined by 0.09GtCO2 and those in the EU fell by 0.05GtCO2, whereas Indian emissions increased by 0.04GtCO2. The rest of the world’s rose 0.08GtCO2.
The total emissions for each year between 2016 and 2019, as well as the countries that were responsible for the changes in emissions, are shown in the figure below. Annual emissions for 2016, 2017, 2018 and estimates for 2019 are shown by the black bars. The coloured bars show the change in emissions between each set of years, broken down by country. Negative values show reductions in emissions, while positive values reflect emission increases.
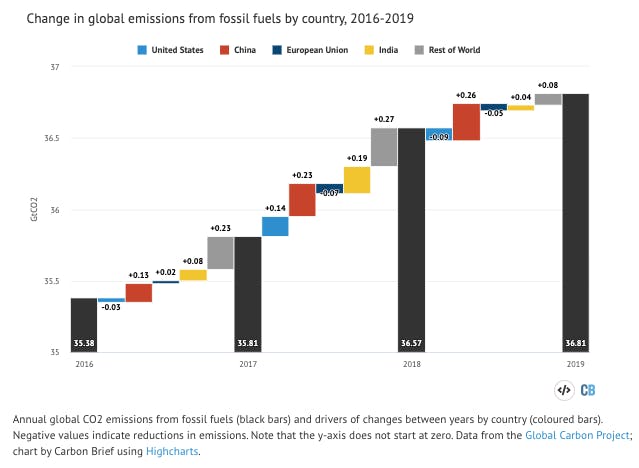
Overall, CO2 emissions from FF&I are expected to rise by around 0.6 per cent in 2019, with a fairly wide uncertainty from as little as -0.2 per cent to as much as 1.5 per cent, given the limitations of data available so far. The GCP will publish more complete 2019 numbers in early 2020.
US
US CO2 emissions from FF&I are expected to decline by -1.7 per cent, with an uncertainty range of -3.7 per cent to 0.3 per cent. Most of this reduction is driven by declining coal emissions, which are set to decrease by 10.5 per cent compared to 2018. Oil emissions are due to fall by 0.5 per cent, while those from natural gas are due to increase by 3.5 per cent and cement by 0.7 per cent.
The US is expected to see the largest change between 2018 and 2019 of any country: from a large (0.14GtCO2) increase during 2018 to a modest decline (0.09GtCO2) in 2019. As Carbon Brief reported last year, a large portion of the increase in US emissions in 2018 was associated with increased energy use from a cold winter followed by a hot summer, though increases in industrial and transportation emissions driven by a growing economy also played a role.
The GCP correctly forecast last year that the 2018 increase was something of an anomalous blip and that US emissions would begin to decline again in 2019, as cheap gas, wind and solar continue to displace coal and temporary weather effects fade.
US emissions have fallen by 13 per cent since their 2005 peak, though they remain above the recent low levels achieved in 2017.
European Union
EU emissions are expected to decrease by -1.7 per cent in 2019, with a range of -2.6 per cent to 1.3 per cent. Coal is set to be the largest driver, with emissions falling 10 per cent compared to 2018. Oil emissions are due to increase by a modest 0.5 per cent, while natural gas emissions are expected to increase by 3 per cent and cement emissions remain unchanged.
At the end of 2019, EU CO2 emissions from FF&I will have fallen by 28 per cent from their 1979 peak and will be at the lowest level since the year 1967.
China
China is expected to be responsible for effectively all the increase in global CO2 emissions in 2019, with a rise of 0.26GtCO2 – larger than the global total increase of 0.24GtCO2. This represents a 2.6 per cent increase in Chinese emissions from 2018 – with an uncertainty of 0.7 per cent to 4.4 per cent – and follows a similar increase of 2.3 per cent in 2018.
Chinese coal emissions are expected to increase by 0.8 per cent, with those from oil by 6.9 per cent and gas by 9.1 per cent. Cement production emissions are due to rise by 6.3 per cent. These increases are driven by continued stimulus spending by the Chinese government and related output from energy-intensive industries, such as steel production.
India
Indian emissions are expected to increase by around 1.8 per cent in 2019, with a range of 0.7 per cent to 3.7 per cent.
A 2 per cent increase in coal emissions is due to be the largest driver, though oil emissions are also expected to increase by 1.5 per cent and natural gas by 2.5 per cent, while cement emissions should remain unchanged.
There is wide uncertainty in Indian emissions for 2019 due to an above-average monsoon year leading to flooded coal mines and high hydropower generation. The Indian economy has also slowed, contributing to a slower-than-average increase in emissions compared to prior years.
The 2019 increase in Indian CO2 emissions from FF&I – 0.05GtCO2 – would be the smallest increase seen since the year 2013.
Rest of world
The rest of the world’s emissions are expected to grow by 0.5 per cent in 2019, with a range from -0.8 per cent to 1.8 per cent. Coal emissions are expected to increase by only 0.1 per cent (with large uncertainties); while oil emissions are due to rise 0.1 per cent, natural gas by 1.3 per cent and cement 1.3 per cent.
The increase in rest-of-world emissions in 2019 – 0.07GtCO2 – would be much smaller than the 0.2GtCO2 average over the past decade and would be the slowest increase since the year 2013.
Gas and oil may drive future emissions
Increases in global CO2 emissions in 2019 are not being driven by coal. In fact, emissions from coal are expected to decline by -0.9 per cent, with an uncertainty range of -2 per cent to 0.2 per cent. (Analysis recently published by Carbon Brief estimated that global electricity generation from coal was set to decline by a record 3 per cent in 2019.)
Rather, emission increases in 2019 are due to increased CO2 from oil (up 0.9 per cent, with a range of 0.3 per cent to 1.6 per cent), gas (up 2.6 per cent, ranging from 1.3 per cent to 3.9 per cent) and cement (up 3.7 per cent, ranging from 0.4 per cent to 7.3 per cent).
The total emissions for each year between 2016 and 2019, as well as the fuels that were responsible for the change in emissions, are shown in the figure below.
While coal played a part in increasing global emissions between 2017 and 2018, it had a much smaller role in other recent years. In every year between 2013 and 2019, gas played a larger role in increasing global emissions than coal.
This reflects declines in coal use in the US and Europe, which have largely offset increases in China, India and other developing countries in southeast Asia. Global CO2 emissions from coal remain below a peak seen in 2012.
While natural gas is responsible for only around half the CO2 per unit of energy generated compared to coal, gas use has increased substantially in recent years and is not only being used to replace coal. These numbers are also not accounting for the climate effects of methane released during natural gas production and distribution.
The figure below shows global CO2 emissions from different fuels over time. While coal emissions increased rapidly in the mid-2000s, it has plateaued since 2013, while gas and oil emissions have steadily grown.
Over the past decade, CO2 emissions from coal have decreased by around 0.01GtCO2 per year on average. At the same time, emissions from oil and gas have each averaged an extra 0.16GtCO2 per year. Cement emissions have increased by 0.03GtCO2 per year.
The GCP researchers suggest that “continued long-term growth in both oil and natural gas use is likely” as per-capita oil consumption in countries such as China and India is still a small fraction of that in the US and EU. Increased exports of liquified natural gas to Asia is lowering traditionally high prices and increasing use. While some of this is displacing coal, it may also be meeting new demand that would otherwise come from clean energy sources.
As the GCP researchers conclude:
“While natural gas may be necessary to aid a transition from coal to non-fossil energy in some national circumstances, expanded natural gas use without CCS [carbon capture and storage] could limit the ability to meet ambitious climate targets.”
The latest GCP estimates can be compared with figures from the Intergovernmental Panel on Climate Change (IPCC) special report on 1.5C. This showed that by 2030, global CO2 emissions should fall by 45 per cent from 2010 levels if warming is to be kept below 1.5C, with coal use falling by 59-78 per cent. It had oil at +3 to -34 per cent against 2010 levels and gas at +21 to -21 per cent.
The global carbon budget
Every year, the GCP provides an estimate of the global carbon budget. This is based on estimates of the release of CO2 through human activity and its uptake by the oceans and land, with the remainder adding to atmospheric concentrations of the gas.
(This differs from the commonly used term “carbon budget”, referring to the amount of CO2 that can be released while keeping warming below global limits of 1.5 or 2C.)
The most recent budget, including estimated values for 2019, is shown in the figure below. Values above zero represent sources of CO2 – from fossil fuels, cement and land use – while values below zero represent “carbon sinks” that remove CO2 from the atmosphere. CO2 emissions either accumulate in the atmosphere, or are absorbed by the oceans or land vegetation.
Land-use changes, such as deforestation and fires, comprise an estimated 14.5 per cent of total CO2 emissions in 2019, up from 14 per cent in 2018. The remaining 85.5 per cent of emissions are from fossil fuels and industry. CO2 emissions from land use are projected to be 6.2GtCO2 in 2019, an increase of 5 per cent from 2018. Total CO2 emissions from all human activity are an estimated 42.9GtCO2, which is 1 per cent larger than the 2018 value of 43.1GtCO2.
According to the GCP estimates, about 44 per cent of CO2 emitted in 2019 will accumulate in the atmosphere. The remainder will have been taken up by carbon sinks – 33 per cent by the land and 22 per cent by the ocean. Land uptake is thought to have been unusually high in 2019 and one of the highest levels in the past few decades, though the cause of this is currently unclear, the authors tell Carbon Brief.
Despite higher emissions, a similar amount of CO2 is set to end up in the atmosphere in 2019 as in 2018, due to an increase in the amount of CO2 absorbed by the land sink. However, atmospheric CO2 concentrations are primarily a result of cumulative emissions over time rather than the emissions during the current year, so the amount of CO2 in the atmosphere continues to grow.
The Global Carbon Budget report projects that the average atmospheric CO2 concentration in 2019 will be 410ppm. This compares with an average of 407ppm in 2018.
This story was published with permission from Carbon Brief.


