
One ongoing argument used by those against the increased uptake of renewables is “they just take up way too much space”, so it was with enormous interest that I picked up on a new study released by the US-based National Renewable Energy Laboratory (NREL).
Their most recent study sought to prove out the hypothesis previously used to estimate land use requirements for medium and large scale PV and Concentrated Solar Plants. The study benefits hugely from having a large data set; it analysed 217 PV and CSP power plants across a number of states, totalling 4.8GW of capacity which represents around 72 per cent of all US installed solar capacity to date.
The report goes into significant detail and looks at a wide range of metrics, variables and assumptions but in short found that the real world land use for solar was pretty damn close to all the previous modeling. It also presents data on an installed capacity and annualised generation basis, and includes both directly occupied and total land use analysis.
On average, it found across the data set that solar technologies will generate around 68 GigaWatt hours per year, per square km of total land. Logically, tracked solar systems required less land per GWH of energy because of their improved annual yields, despite the fact that they need to be spaced out further; up to 30 per cent more in the best case.
So if you are like me (and some of the press who cited on the report), one of your first questions would be “ok great; how does this compare to non-renewable generation land use?” Intriguingly, although the report doesn’t mention it, NREL’s web page launch refers to another related study by Columbia University which concluded that “on a life-cycle electricity-output basis—including direct and indirect land transformation—utility-scale PV in the US Southwest requires less land than the average US power plant using surface-mined coal”.
Now that is a show stopper and a conclusion I had not been able to come to myself when I had previously looked at the issue, so I spent most of today geeking it up, reading both reports and collected data on Australian land use.
Here is what I found.
Firstly, on a pure, annualised energy output basis solar won’t beat a coal mine and generator, although it’s not as far off as the Luddites might have you think.
Secondly and most importantly there is a key difference between annual and life cycle energy output analysis. The life cycle analysis needs to take into account things such as growth in land use (as mines insatiably expand), buffer zones, waste processing land use, toxic by-products, and water use to name a few; and extrapolating them out over time is very challenging. However, logically, one can understand that over time a coal mine which produces waste and uses a lot of water will have a growing footprint whereas solar has a pretty much static footprint.
I also noted the references to the ability to rehabilitate land; and numerous cases (including some in southern Queensland) were promised coal mine repatriation had simply not occurred because the companies had gone bust or moved on, leaving the community with a big hole. This is also considered in the life cycle analysis in the form of a risk factor.
So, when considered on a whole of life basis, the picture is far more complex than a simple energy per km2 outcome, and quite rightly so.
This type of analysis and comparison is in its infancy due to the recent history of solar, and (based on my experience today) because simply trying to understand how much land is used for mining and non renewable generation in Australia is so hard to get. But I did get some.
Fact 1. The Australian Bureau of Statistics lists all mines in Australia up to the end of 2011 and allowed me to filter to purely look at operational coal mines.
Fact 2. The NSW government has a new website designed to bust the myths about mining in our resource-rich state. It describes how NSW only uses 0.1 per cent of its land used for mining, which is equivalent to 802km2 (an area 28km x 28km). To put this in perspective, that is about half of the entire greater Sydney area.
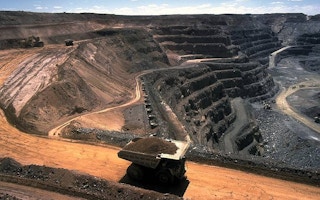
Fact 3. Using government-operated tenure maps, I was able to locate a couple of large mines and power stations and physically measure them. Liddell Power station and its associated (close proximity) mines for example, requires around 34km2 of land; probably far more. This compares well to Hazelwood who have gone on the record saying they have 35km2 of land. We also looked at Anglsea who have around 6km2 according to their website and we started to get a range.

(NB; the image at the top of this map shows the tenure map with Liddell in Yellow and nearby coal mines in blue)
Try as I may, I could not for the life of me find the land area of the remaining 122 operating coal mines in Australia; but in fairness not all the coal is used in Australia for generation either. To get an indication however, I applied the 6km2 per mine data point from Anglesea and applied that across each of the other mines. Some may be smaller, the majority are likely to be bigger.
The result? The approximate land area for Australian coal mines (excluding generators, waste supply, buffers and waste land in many cases) is somewhere around 1184km2 by our rough estimates.
Now, previous studies (Beyond Zero, the UNSW and the recent AEOMO report into 100% renewables) all conclude that the area required to convert our annual energy requirements to 100% renewables is somewhere around 2500km2 and 5000km2 (we used around 204TwH in 2011-2012). Using the findings from the NREL study we can calculate (based on their real empirical data) we would need 2300km2; so they are both close but we’ll we’ll call it 2500km2.
Here’s the summary then of what we need to meet for our annual energy requirements:
- coal mining requires around 1100km2 of land, or 33km X 33km
- solar requires around 2500km2 of land, or 50km X 50km
So thats about double the space for solar, at worst, being pretty conservative.
However, as the life-cycle electricity-output basis study showed in the US, when the lifetime costs are taken into account the picture changes dramatically. Definitive data doesn’t exist here yet and so these are not firm answers but it’s yet another strong indication that things are no-where near as bad for solar as some make out.
I, for one, would live to see a definitive study done on this issue so we can get some hard facts around it.
This post originally appeared here.