The 300-page report, now in its 26th year, is an annual assessment of the world’s climate, scrutinising the Earth’s land, oceans, ice and atmosphere. It is compiled by more than 450 scientists from 62 countries.
Carbon Brief takes a look at how rising greenhouse gas emissions, with the help of a strong El Niño event, made 2015 into a record-breaker.
Greenhouse gases
Last year was record-breaking for concentrations of all three of the main long-lived greenhouse gases that contribute to climate change: carbon dioxide (CO2), methane (CH4), and nitrous oxide (N2O).
At the Mauna Loa Observatory, where scientists have been monitoring CO2 since the 1950s, the average concentration for the year as a whole surpassed 400 parts per million (ppm) for the first time. At 400.8ppm, CO2 levels in the atmosphere were 3.1ppm greater than 2014 – the largest annual increase of the 58-year record.
In addition, March 2015 was the first time average CO2 concentration across the globe has been more than 400ppm for an entire month. Global annual average CO2 levels for 2015 finished just shy of the 400ppm milestone, at 399.4 ppm. You can see this in the chart below, one of several graphics produced alongside the report.
Meanwhile, levels of both methane and nitrous oxides reached new record highs in 2015, at 1834.0 parts per billion (ppb) and 328.2ppb, respectively.
Global surface temperature
As was widely reported in January, observations show that 2015 was the hottest year on record.
The 2015 globally averaged surface temperature was 0.42-0.46°C above the 1981–2010 average, topping the previous record set in 2014 by 0.13-0.18C. The range in values reflect the different datasets used by various meteorological agencies to calculate global temperature.
2015 was also the first year to see average global temperatures surpass 1C above pre-industrial levels. 14 of the 15 warmest years on record have now occurred since the beginning of the 21st century, the report notes, with 1998 the only exception.
The strong El Niño event in the Pacific Ocean contributed to the record global temperatures, the report says, though it does not quantify by how much. Prof Adam Scaife, head of long-range forecasting at the Met Office, told Carbon Brief earlier this year that El Niño made a contribution of only a few hundredths of a degree to the 2015 record.
El Niño is expected to have more of an impact on 2016’s average temperature, Scaife noted, contributing “around 25 per cent to what will most likely be a new record global temperature in 2016.” Across the global land surface, record or near-record warmth was reported across every inhabited continent, the report says. Twelve countries – such as Russia and China – reported record high annual average temperatures.
“
Looking at a range of climate measurements, not only was 2015 the warmest year on record by a large margin, it was also another year when the levels of dominant greenhouse gases reached new peaks and sea levels and ocean heat content were all at their highest levels.
Kate Willett, report co-author and senior scientist, Met Office
Land temperatures in 2015 saw a record number of warm days – which are days where the maximum temperature reaches the top 10 per cent for the average for that season during 1961-90. Globally, 2015 saw almost twice the number of warm days than the annual average for 1961-90.
There were also a record low number of cool days in 2015. These are days when the maximum temperature doesn’t rise above the chilliest 10 per cent of days for that season during 1961-90. There were almost half the number of cool days in 2015 than the average for 1961-90.
Oceans
As well as above the surface, 2015 was a record year for the world’s oceans.
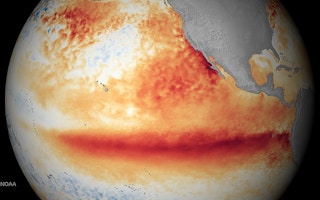
Global sea surface temperatures (SSTs) in 2015 were 0.33-0.39C above the 1981-2010 average, surpassing the previous record set in 2014 by 0.10-0.12C. The strong El Niño during 2015 contributed to record high SSTs across much of the tropical Pacific Ocean, the report notes, which boosted global SSTs. You can spot the El Niño event in the map below by the warm SSTs in the central and eastern tropical Pacific Ocean.
The whole of the top 700m of the world’s oceans saw record warming in 2015, exceeding the record set in 2014. As oceans absorb over 90 per cent of the heat trapped by the Earth’s atmosphere, the level of warming reflects the continuing accumulation of heat in the upper layer of the oceans, the researchers say.
This story was originally published by Carbon Brief under a Creative Commons’ License.
Read the full story here.


