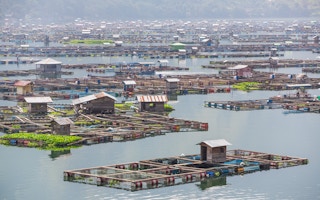
Global trade has made it easier to buy things. But our consumption habits often fuel threats to biodiversity — such as deforestation, overhunting and overfishing — thousands of miles away.
Now, scientists have mapped how major consuming countries drive threats to endangered species elsewhere. Such maps could be useful for finding the most efficient ways to protect critical areas important for biodiversity, the researchers suggest in a new study published in Nature Ecology & Evolution.
“Conservation measures must consider not just the point of impact, but also the consumer demand that ultimately drives resource use,” the researchers write in the paper.
Researchers Daniel Moran of the Norwegian University of Science and Technology and Keiichiro Kanemoto of Shinshu University in Japan, identified 6,803 threatened species (species that are listed as vulnerable, endangered or critically endangered on the IUCN Red List), and pinpointed the commodities that contribute to various threats affecting those species.
Then they traced the implicated commodities to their final consumers in 187 countries using a global trade model.
The resulting maps can tell which countries, and which commodities, threaten species at the various hotspots, the researchers say.
For example, the maps show that commodities used in the United States and the European Union exert several threats on marine species in Southeast Asia, mainly due to overfishing, pollution and aquaculture. The U.S. also exerts pressure on hotspots off the Caribbean coast of Costa Rica and Nicaragua, and at the mouth of the Orinoco around Trinidad and Tobago. European Union’s impacts extend to the islands around Madagascar: Réunion, Mauritius and the Seychelles.
“
Once you connect the environmental impact to a supply chain, then many people along the supply chain, not only producers, can participate in cleaning up that supply chain.
Daniel Moran, researcher, Norwegian University of Science
The maps also revealed some unexpected linkages. For instance, the impact of U.S. consumption in Brazil appears to be much greater in southern Brazil (in the Brazilian Highlands where agriculture and grazing are extensive) than inside the Amazon basin, which receives a larger chunk of the attention.
The U.S. also has high biodiversity footprint in southern Spain and Portugal, due to their impacts on threatened fish and bird species. These countries are rarely perceived as threat hotspots.
EU consumption is fueling threats in African countries like Morocco, Ethiopia, Madagascar, and Zimbabwe. Similarly, consumption in Japan is driving threat hotspots in Southeast Asia, and around Colombo and southern Sri Lanka, where threats are linked to tea, rubber, and other manufactured goods sent to Japan.
The researchers write that their maps can help connect conservationists, consumers, companies and governments to better target conservation actions. Companies, for example, can use the maps to see where their inputs are sourced and to reduce their biodiversity impacts.
Conservationists, too, can use the maps to identify the intermediate and final consumers whose purchases sustain industries that threaten endangered species.
“Connecting observations of environmental problems to economic activity, that is the innovation here,” Moran said in a statement. “Once you connect the environmental impact to a supply chain, then many people along the supply chain, not only producers, can participate in cleaning up that supply chain.”
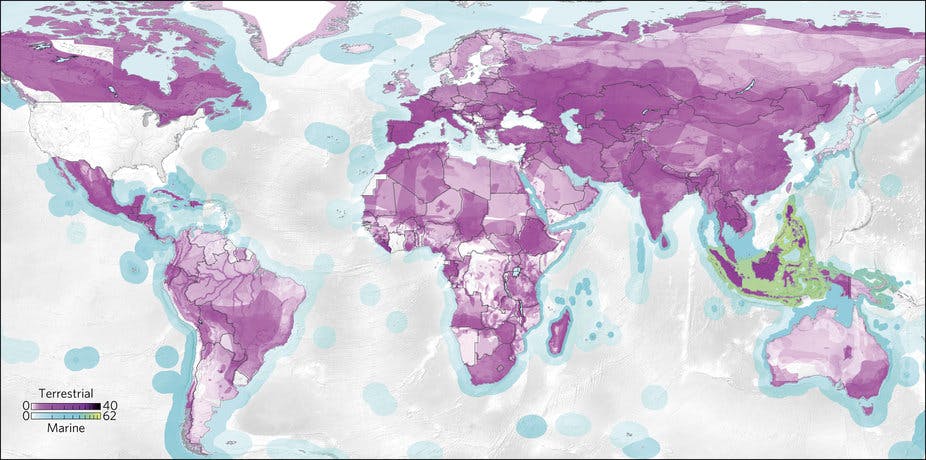
Map showing areas of threat hotspots driven by US consumption. Map by Moran and Kanemoto, Nature, Ecology & Evolution (2016) via Mongabay.com
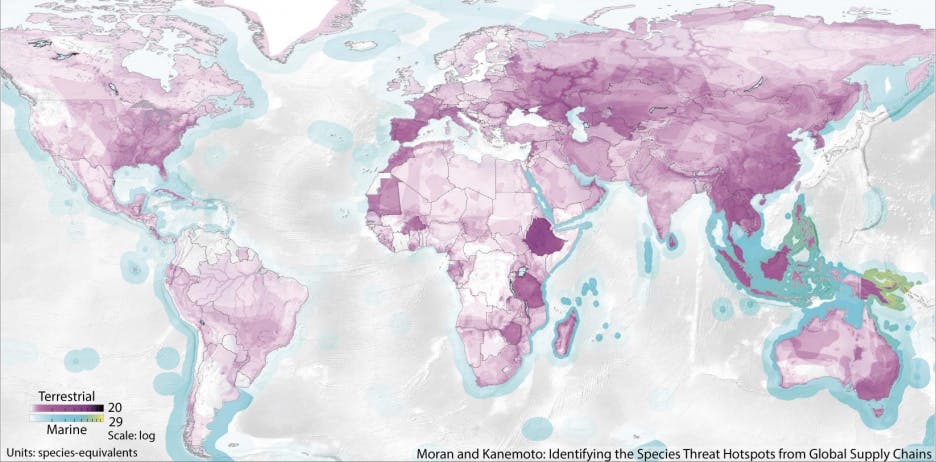
Global species threat hotspots linked to consumption in Japan. Map by Moran and Kanemoto, Nature, Ecology & Evolution (2016) via Mongabay.com
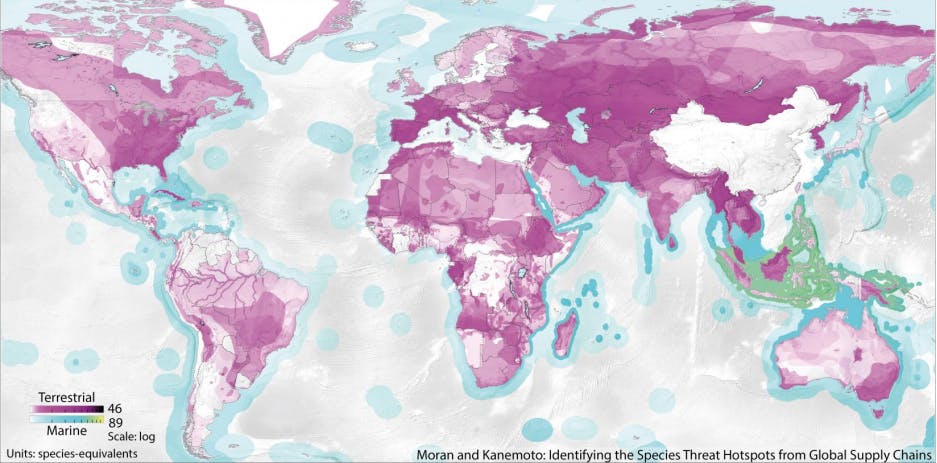
Global species threat hotspots linked to consumption in the China. Map by Moran and Kanemoto, Nature, Ecology & Evolution (2016) via Mongabay.com
This story was published with permission from Mongabay.com


