Spatial data from satellites are now fine-scale enough to provide land use and vegetation cover information at the level of individual farms. An international team of researchers examined the potential of remotely sensed satellite data to help monitor rural poverty in lower-income countries. They found that certain local environmental features, including agricultural land uses, are related to the level of wealth of households and villages and can be quantified by satellite data.
A reliance on natural resources
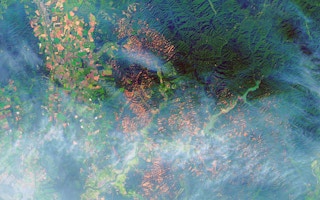
Imagery taken from satellites helps scientists map the Earth’s surface. Using these images, scientists quantify different types of land cover, distinguishing areas of forest from those dominated by scrub, grassland, crops, or water. By analysing satellite data from different time periods, researchers assess changes in vegetation cover across the globe.
Rural residents in lower-income countries rely on natural resources for food, fuel, building materials, and medicines. Loss of these resources is likely associated with lower socioeconomic circumstances. Some features of environmental resources, such as the size of a woodland or its proximity to a road, can be obtained from satellite imagery.
Governments in many countries traditionally monitor national well-being through on-the-ground household surveys. These surveys are often expensive and time-consuming and so are usually conducted every 10 years.
The internationally agreed-upon Sustainable Development Goals, aimed at reducing poverty while protecting the environment, have spurred a search for more frequent collection of socioeconomic and environmental data to monitor countries’ progress toward achieving them.
The research team tested whether fine-scale environmental data derived from satellite imagery could shed light on a household’s socioeconomic status and the family’s interactions with the surrounding environment. Specifically, they asked whether environmental characteristics extracted from satellite data could predict household wealth and explain the differences in wealth among households of a given region without having to survey them on the ground.
“High-resolution satellite imagery is relatively cheap and collected frequently,” lead author Gary Watmough of the University of Edinburgh told Mongabay. “Satellite imagery can show us information about a landscape and the way that land is being used and how this is changing over time.”
“
The main focus is on identifying known relationships between environmental resources and wellbeing and then working out how we can best estimate this environmental resource from satellite imagery.
Gary Watmough, lead author, University of Edinburgh
Analysing resource-related wealth
Wealth and income potential from the local landscape can vary among households in a single village, the authors state in their paper, so remote sensing data need to be at a fine enough spatial scale to measure the land cover for a single farm or homestead. Analysing environmental data solely by village or census district may bias results by masking these individual differences.
The 1,150 homesteads in the study landscape were small family compounds with several structures, gardens or woodlots, and a surrounding hedge. The researchers used responses from 231 households in a 2005 on-the-ground household survey to create a relative wealth index, which they compared to environmental information derived from a high-resolution 2004 WorldView QuickBird satellite image.
The high-resolution QuickBird satellite image data (pixels smaller than 1 x 1 metres, or 3 x 3 feet, in size) used by the current study permitted the researchers to extract the area within each homestead dedicated to grassland for grazing livestock, crop fields, bare ground, and woodlots maintained for timber and fruit, as well as roads and buildings.
The researchers analysed the spatially referenced data on land cover and landscape features at several scales to incorporate resources: (1) used exclusively by a single household; (2) agricultural land around the homestead shared among neighboring homesteads; (3) the often-communal lands and water around the village; and (4) community infrastructure in the surrounding region.
They also estimated the size of buildings within each homestead, as a potential indicator of wealth, and extracted data on vegetation productivity and distances to roads, paths, and a local market.
“We have a project running at the moment that is looking at the best ways in which remote sensing can be used to predict aspects of wellbeing,” Watmough said. “The main focus is on identifying known relationships between environmental resources and wellbeing and then working out how we can best estimate this environmental resource from satellite imagery.”
Their analyses of the remotely sensed data found that the size of buildings inside individual homesteads was the most important indicator of a family’s wealth. Bare and planted agricultural land, as well as number of growing days in the year, were other important indicators.
The poorest households had more bare soil within and around the compound, which the authors said could represent either recently harvested fields or unproductive ones.
Pixels in poorer compounds were more often in areas of shorter growing periods. The researchers examined a greenness (normalized difference vegetation index, or NDVI) time series to assess the annual growing period between 2001 and 2006. Although this information was available only at a much coarser 500-meter (1,640-foot) resolution MODIS data, Watmough said it did seem to agree with the team’s knowledge of the situation on the ground in this region.
“Poorer households work on wealthier households’ farms first, helping to prep and plant at the beginning of the season,” Watmough said, “and the money they earn from this can be used to buy the inputs they need for their own fields. So they have a shorter season than wealthier households because they plant later.”
The poorest homesteads also had more of their compound land classified as common land, which are likely to be used more heavily than proprietary lands. The authors said that incorporating remotely sensed data on common pool resources, which may be critical to specific households during difficult times, could help determine whether they are being overused and possibly being degraded over time.
Overall, the multiple-scale analysis of the environmental characteristics from satellite data predicted household wealth in this Kenyan landscape with an overall accuracy of 45 per cent. It explained the variation in wealth within the poorest households with 62 per cent accuracy, despite differences in how individual households interacted with the surrounding environment.
One curious predictor of household wealth was the overall size of its buildings. “Detecting building size from satellite images is really exciting,” Watmough said, and they didn’t change seasonally like NDVI or other more natural features do in satellite images. “So it may form the basis of a consistent long term approach to monitoring socioeconomic conditions,” he added.
A new frontier for monitoring well-being?
The researchers suggest that the increasing availability of high-resolution satellite data will enable their method to be better able to monitor progress toward meeting the sustainable development goals.
For example, the remotely sensed data required to produce NDVI time series for an individual field, Watmough said, are increasingly available from new high-resolution satellites such as the 3-meter resolution Planet constellation (available from 2014) and the 10-meter resolution Sentinel-2 [radar] dataset (launched in 2015).
“The data available from satellites are improving and increasing all of the time,” he said, “so in the future it’s possible that satellite images will form a key part of monitoring socioeconomic conditions and supporting the existing data from household surveys.”
To be successful, Watmough added, the approach of predicting well-being from remotely collected environmental data will have to be adaptable and “will need to reflect the local conditions and how people are using the land.”
So while satellite data could at some point identify areas facing extreme poverty and those likely to affected by poverty, “the work should be seen as a proof of concept that it is possible to use high resolution imagery to estimate aspects of rural wellbeing.”
This story was published with permission from Mongabay.com.


