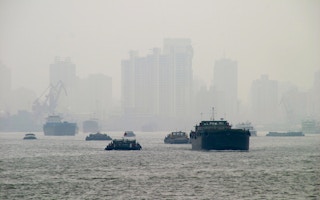

New data on urban air quality from the World Health Organisation recently led Onitsha, Nigeria to be given the title of “most polluted city” in the world. International media also singled out the “most polluted city” in their region, and highlighted countries such as India which had several cities in the “top five”.
Of course, it’s important to highlight cities where pollution is a big concern. Air pollution is a “silent killer”, which can increase the risk of stroke, heart disease, lung cancer and respiratory diseases such as asthma. Often, poorer and more vulnerable groups, such as children and the elderly suffer these effects the most.
But this “name and shame” approach risks being inaccurate and misleading. For one thing, the pollutants that cause poor air quality can vary significantly between cities. Saying one city is more polluted than another is a bit like comparing apples and oranges – particularly when it comes to developing countries. To understand why, we need to dig down further into the data.
Attention to detail
For its analysis, the WHO looked at levels of two types of particulate matter – PM₁₀ (which has a mean aerodynamic diameter of ten micrometres) and PM₂.₅ (which has a mean aerodynamic diameter of 2.5 micrometres) – for 796 cities from 2008 to 2013.
PM₁₀ and PM₂.₅ include pollutants such as sulphates, nitrates and black carbon (soot), which penetrate deep into the lungs and into the cardiovascular system, posing the greatest risks to human health.
Unsurprisingly, the WHO analysis shows higher levels of urban air pollution in low and middle-income regions such as Africa, Latin America and South-East Asia. In these areas, a lack of funding and inadequate capacity to monitor air quality make it difficult to effectively reduce air pollution.
Based on PM₁₀ data, Onitsha, Nigeria topped the list in Africa, while Bamedna, Tanzania, had the highest PM₂.₅ levels. In the Americas, Santa Gertrudes, Brazil, had the worst PM₁₀ pollution, and Lima, Peru, topped the list for PM₂.₅.
“
Saying one city is more polluted than another is a bit like comparing apples and oranges – particularly when it comes to developing countries.
In the Eastern Mediterranean and South-East Asia (which are clustered together in the database), Peshawar, Pakistan, is number one for PM₁₀, and Zabol, Iran, for PM₂.₅.
And these examples focus only on particulate matter. The rankings would be more diverse if other common pollutants – such as nitrogen dioxide, sulphur dioxide and ozone – were included in the database.
Apples and oranges
There are several other reasons why the air quality of different cities cannot be directly compared. For example, different seasons have unique meteorological conditions and activities, which may cause dips or spikes in pollution.
For instance, a city will have greater pollutant concentrations in a dry year than in a wet year, and higher levels of particulate matter at times when agricultural refuse is burned. So using data for one season to extrapolate an annual mean pollution level could skew the results.
What’s more, some cities will not make the “most polluted” list simply because they do not monitor air quality as is the case in some African cities. And even cities that do monitor pollution levels will have different numbers of monitoring stations in different sites.
For example, the stations may be concentrated in less-polluted, residential areas in one city, and on busy roads with high pollution in another. A minimum number of monitoring stations is needed to obtain spatially representative data.
The methods used to monitor different pollutants and analyse the data may also differ, requiring adjustments to make the data comparable. Finally, quality assurance and control of monitoring data, selection of instruments, calibration and documented performance in one city cannot be compared with a city of unknown data quality.
Only by considering these variations can we accurately compare cities within and between countries. Otherwise, any rankings will be misleading. There are also political consequences: if city officials fear being “named and shamed”, they have a strong incentive to hide their data or under-report pollution. The controversy over Beijing’s air quality data highlights these risks.
Clean air is a basic human right, and we urgently need to act to reduce air pollution – particularly in developing countries. Rankings and lists which single out the “worst cities” do not advance this cause: they only serve to misrepresent the data and politicise a public health issue.
If we are to save lives now and protect future generations, we need to resist the clickbait headlines, and be more thoughtful and precise when talking about urban air quality.
![]()
Gary Haq is senior research associate in Sustainable Development, Human Ecology, University of York; Bjarne Sivertsen is associate research director, Norwegian Institute for Air Research, and Dieter Schwela is research associate, University of York. This article was originally published on The Conversation.


