Global average temperatures could pass 1.5C above pre-industrial levels within the next decade, new projections suggest.
The timing of when we actually hit the 1.5C threshold will depend heavily on a natural cycle in the Pacific Ocean, the study finds, which can either dampen or accelerate global temperature rise.
The results suggest, on current trends, that warming is likely to reach 1.5C between 2026 and 2031, though it could be even earlier. This means that, with the Intergovernmental Panel on Climate Change due to publish its special report on 1.5C in 2018, global temperature rise might arrive at that milestone just eight years later.
That doesn’t mean that 1.5C is a lost cause, other scientists tell Carbon Brief. But the most plausible way of keeping to the 1.5C limit by the end of the century is to overshoot and come back down to it afterwards.
Trajectory towards 1.5C
In 2015, global average annual temperatures hit the landmark of a full 1C above pre-industrial levels. The following year, annual temperatures passed 1.1C of warming.
While these record temperatures were spurred on by a strong El Niño event in 2015 to 2016, they show that warming of 1.5C – an aspirational limit laid out in the Paris Agreement – is rapidly approaching.
With this in mind, the new Geophysical Research Letters study estimates the trajectory of global temperatures towards 1.5C. The research shows that, along with human-caused emissions, how quickly we reach 1.5C will depend heavily a natural cycle in the Pacific Ocean called the Interdecadal Pacific Oscillation (IPO).
The IPO has two opposite phases: positive (also known as the “warm” phase) and negative (“cool”). The phases affect the strength of the trade winds that blow east-to-west across the tropical Pacific Ocean. These winds are themselves driven by warm air rising along the equator and the rotation of the Earth.
During a negative IPO phase, the trade winds strengthen, driving heat into the deep Pacific Ocean, which brings cooler water to the surface. Since 2000, the IPO has been in its negative phase, and the cooling effect is thought to play a role in the recent slowdown in global surface temperature rise.
But in its positive phase, the oceans release large amounts of heat into the atmosphere, boosting the warming caused by rising greenhouse gas emissions.
“
Given our rapid approach to the 1.5C threshold, the most plausible way to reach it would be to overshoot and attempt to come back down to it afterwards with policies that would significantly reduce greenhouse gas emissions going forward.
Jerry Meehl, National Centre for Atmospheric Research (NCAR) in Colorado
The figure below show how the pattern of global temperature rise (upper chart) has been influenced by the phase of the IPO (lower chart). The faster periods of warming, such as in the 1980s and 1990s, have coincided with a positive phase of the IPO, while warming has been slower during negative IPO phases – as we’ve seen in the early 2000s.
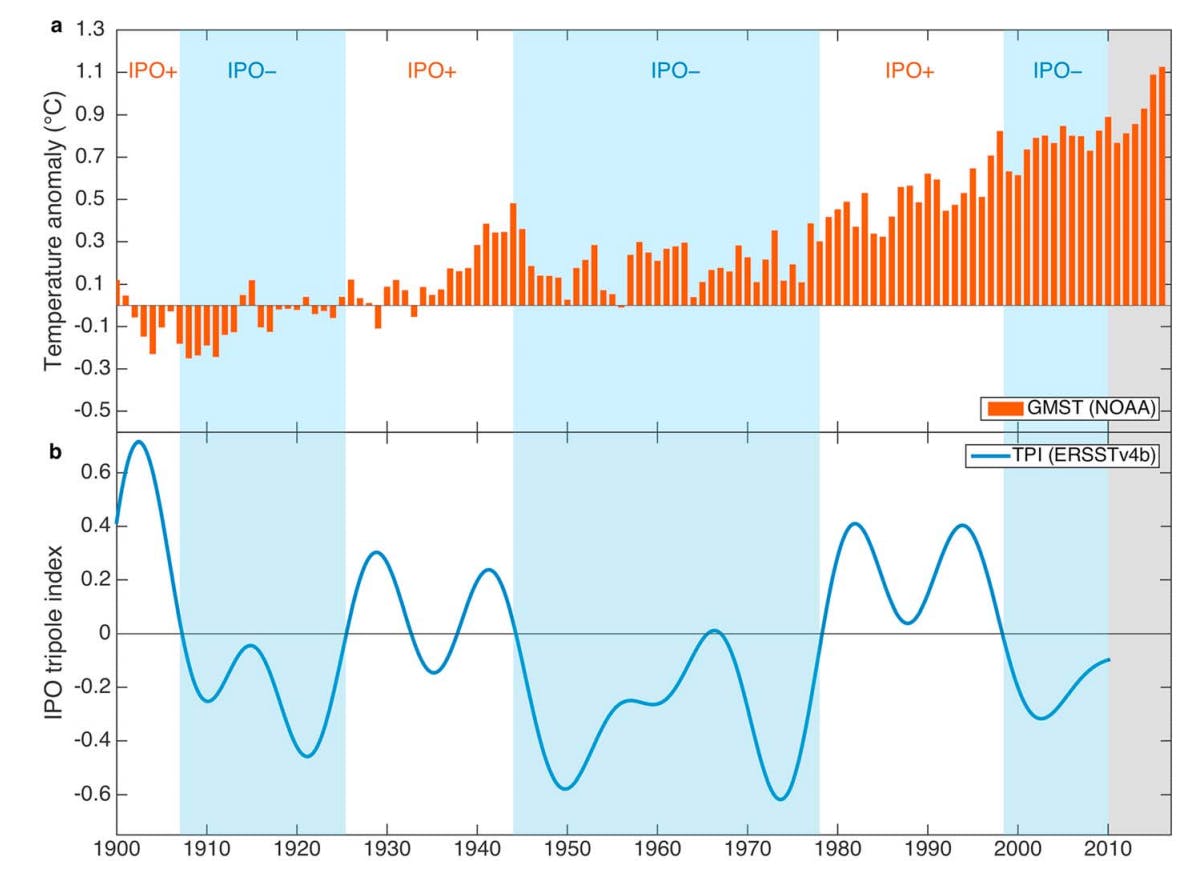
Charts showing a) global average surface temperature (relative to 1850-1900), and b) the IPO index, for 1900 to 2016. Background colour indicates IPO index: positive (white) or negative (blue). Source: Henley & King (2017)
Although the IPO is thought to be related to the El Niño-Southern Oscillation (ENSO), it tends to have longer phases – even for multiple decades – rather than the shorter 2 to 7 year cycles of ENSO.
The upshot is that the rate that global temperatures approach 1.5C is likely to be significantly quicker, or slower, depending on the phase of the IPO, the paper says.
Breaching 1.5C
Looking ahead, the researchers ran a set of climate model simulations to create global temperature projections in periods of positive and negative IPO. Lead author Dr Benjamin Henley from the University of Melbourne explains to Carbon Brief:
“Allowing for the short-term warming due to the 2015 to 2016 El Niño, estimated at 0.1C, we projected the two sets of temperature sequences forward from the current global temperature, using the 1850-1900 timeframe as a pre-industrial baseline.”
You can see the results in the chart below. The solid coloured lines show the projected global temperature under positive (orange) and negative (blue) IPO in the coming decades, and the dotted lines indicate when 1.5C of warming could be breached.
With a faster rate of warming under a positive IPO, global temperature rise could hit 1.5C by 2026. If the IPO is negative in the coming years, the 1.5C milestone would be delayed for around five years to 2031.
Last month, Carbon Brief published analysis showing that, at the current rate of emissions, we’ll blow the budget for a good chance of staying below 1.5C within four years. The figures in the new study reflect the time lag between our emissions and the warming that they cause.
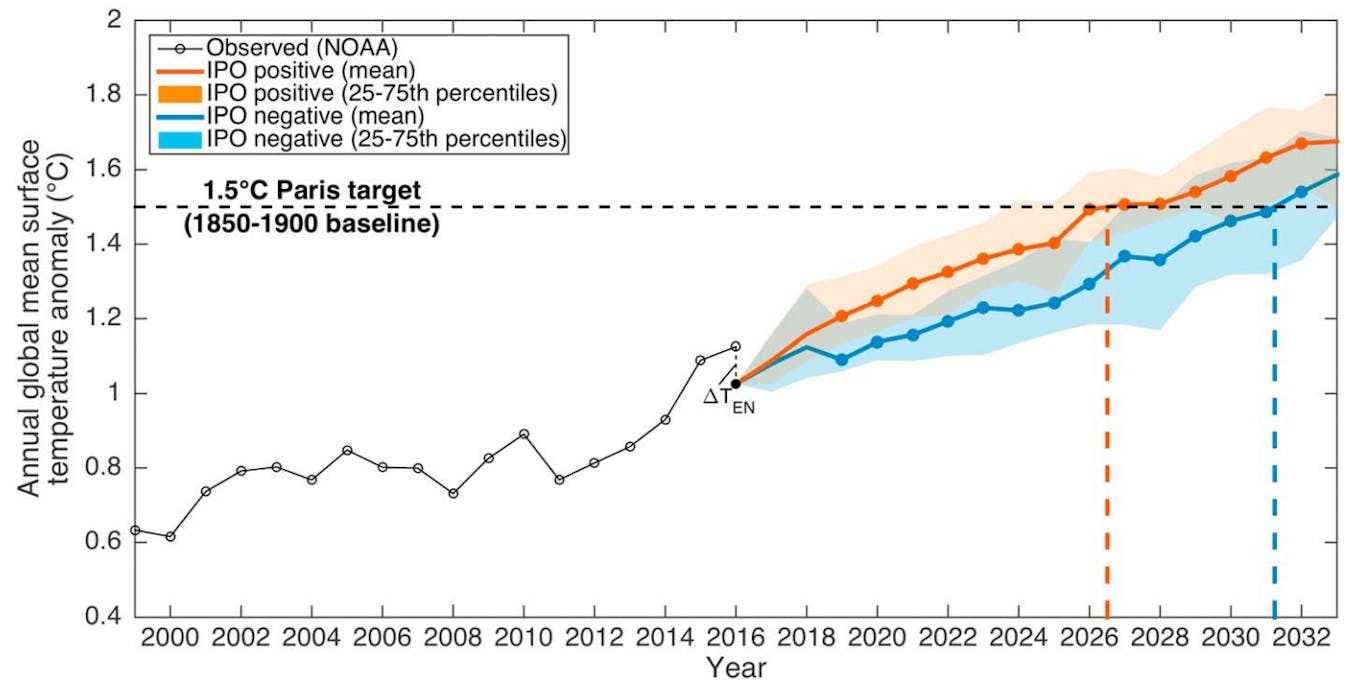
Annual observed and near-term projections of global average surface temperature (relative to 1850-1900). Projections continue from where the observations end in 2016, minus the boost to temperatures from El Niño (0.1C). Projections are shown under IPO positive (orange) and negative (blue) conditions, and the dotted line indicates when 1.5C above pre-industrial levels is reached. The solid lines show the model average, and the shaded areas show the 25-75th percentile range of all the models. Source: Henley & King (2017)
It’s worth noting that the solid lines in the chart show the average of all the models, while the shading shows the range in the projections. So the first year of hitting 1.5C could be a few years earlier or later than the dotted lines indicate. The timing of 1.5C could also be delayed by the cooling influence of a large volcanic eruption, the authors note.
These figures refer to the first time that global average annual temperatures reach 1.5C. This is just one way of classifying passing the 1.5C threshold – for example, another would be where the five-year average global temperatures exceed 1.5C above pre-industrial.
Turning positive?
So, if the timing of when we reach 1.5C of warming depends on the phase of the IPO, which phase are we more likely to see in the coming years?
Well, it’s difficult to say at the moment. Researchers know that IPO was negative until at least 2014, Henley says, but after that it’s quite difficult to know for sure what direction the IPO is going to turn.
A recent modelling study suggests that the IPO will soon shift – or has already shifted – into its positive phase, bringing “larger rates of global warming over the 2013–2022 period.” But scientists can’t yet say for certain, Henley adds:
“It remains a significant challenge to reliably predict long-term variations in ocean circulation, due to data limitations and the inherently chaotic nature of the ocean-atmosphere system.”
Overshoot
The study highlights how natural variations in climate can temporarily affect the rate that global temperatures increase, says Dr Ed Hawkins, associate professor at the University of Reading, who wasn’t involved in the study. He tells Carbon Brief:
“The particular phase of the these variations that we experience over the next couple of decades may change the timing of when Earth’s temperature crosses the 1.5C threshold defined in the Paris Agreement.”
This doesn’t mean that aiming to limit global temperature rise to 1.5C is a lost cause, says Prof Jerry Meehl, from the National Centre for Atmospheric Research (NCAR) in Colorado, who also wasn’t involved in the research. He tells Carbon Brief:
“Given our rapid approach – one way or another – to the 1.5C threshold, the most plausible way to reach it would be to overshoot and attempt to come back down to it afterwards with policies that would significantly reduce greenhouse gas emissions going forward.”
In fact, with 1.5C so close, the research reinforces the need for the forthcoming IPCC special report, adds Dr Doug Smith, who leads on decadal climate prediction research and development at the Met Office Hadley Centre, and also wasn’t involved in the study. He tells Carbon Brief:
“Before Paris, the focus was mainly on 2C, so the 1.5C report will tell us a lot about how sensitive the impacts are [to warming], and potentially provide further motivation for limiting warming as much as possible.”
This story was published with permission from Carbon Brief.


